Royston (Iceni) Weather Station
Daily Weather Observations - June 2013
(All Times GMT)
| Date | Max. Temp. (°C) 09/09h | Min. Temp. (°C) 09/09h | Grass Min. Temp. (°C) 21/09h | Earth (30cms) Temp. (°C) 09h | Sun (Hours) 00/00h | R'fall (MM) 09/09h | Wind Dir'n 09h | Mean Wind Speed (MPH) 00/00h | Max. Gust Speed (MPH) 00/00h | Cloud Cover (Oktas) 09h | Mean MSL Air Pressure (mB) 00/00h | Mean Rel. Humd. (%) 00/00h | Mean Temp. (°C) 00/00h | Fog (vis. <1000m @ 09h) | Fog (vis. <200m @ 09h) | Snow or Rain and Snow 00/00h | Snow Lying @ 09h (>50% cover) | Hail 00/00h | Thunder 00/00h | Date |
| 1 | 16.8 | 10.0 | 7.5 | 14.1 | 0.7 | 0.0 | NW | 5.9 | 20 | 8 | 1022.4 | 80.6 | 12.6 | 0 | 0 | 0 | 0 | 0 | 0 | 1 |
| 2 | 19.1 | 6.7 | 3.9 | 13.9 | 12.7 | 0.0 | N | 5.6 | 22 | 1 | 1028.2 | 71.2 | 12.4 | 0 | 0 | 0 | 0 | 0 | 0 | 2 |
| 3 | 19.8 | 5.5 | 2.6 | 14.4 | 14.2 | 0.0 | NE | 4.3 | 26 | 0 | 1031.0 | 68.4 | 12.7 | 0 | 0 | 0 | 0 | 0 | 0 | 3 |
| 4 | 20.8 | 3.6 | 0.9 | 14.7 | 15.6 | 0.0 | NE | 6.2 | 23 | 0 | 1026.6 | 75.6 | 12.4 | 0 | 0 | 0 | 0 | 0 | 0 | 4 |
| 5 | 19.2 | 8.0 | 6.5 | 15.2 | 8.4 | 0.0 | NE | 5.5 | 19 | 8 | 1021.4 | 81.9 | 12.1 | 0 | 0 | 0 | 0 | 0 | 0 | 5 |
| 6 | 22.2 | 6.2 | 3.9 | 15.3 | 12.3 | 0.0 | NE | 5.7 | 21 | 4 | 1021.8 | 76.2 | 13.5 | 0 | 0 | 0 | 0 | 0 | 0 | 6 |
| 7 | 22.6 | 6.7 | 4.1 | 15.9 | 13.7 | 0.0 | NE | 6.7 | 23 | 1 | 1023.3 | 74.6 | 14.0 | 0 | 0 | 0 | 0 | 0 | 0 | 7 |
| 8 | 16.9 | 7.4 | 5.0 | 16.4 | 0.9 | 0.0 | NE | 7.5 | 23 | 8 | 1021.4 | 80.7 | 11.5 | 0 | 0 | 0 | 0 | 0 | 0 | 8 |
| 9 | 16.0 | 9.4 | 9.1 | 15.9 | 3.0 | 0.0 | NE | 6.4 | 21 | 8 | 1016.4 | 79.0 | 11.4 | 0 | 0 | 0 | 0 | 0 | 0 | 9 |
| 10 | 13.6 | 8.0 | 4.3 | 15.3 | 1.9 | TR | E | 1.8 | 13 | 8 | 1015.1 | 77.1 | 10.8 | 0 | 0 | 0 | 0 | 0 | 0 | 10 |
| 11 | 19.1 | 7.2 | 4.8 | 14.6 | 3.4 | TR | SE | 6.5 | 20 | 8 | 1012.4 | 82.0 | 14.1 | 0 | 0 | 0 | 0 | 0 | 0 | 11 |
| 12 | 20.2 | 13.1 | 11.7 | 15.5 | 2.6 | 0.2 | SW | 13.2 | 39 | 4 | 1008.9 | 83.1 | 16.1 | 0 | 0 | 0 | 0 | 0 | 0 | 12 |
| 13 | 18.1 | 12.9 | 11.5 | 16.0 | 2.8 | 0.6 | SW | 13.9 | 41 | 8 | 1009.0 | 80.9 | 14.0 | 0 | 0 | 0 | 0 | 0 | 0 | 13 |
| 14 | 19.6 | 8.2 | 6.6 | 15.2 | 7.8 | 2.0 | SW | 8.2 | 26 | 7 | 1013.9 | 72.6 | 14.1 | 0 | 0 | 0 | 0 | 0 | 0 | 14 |
| 15 | 17.6 | 10.3 | 8.5 | 15.4 | 9.1 | 1.5 | SW | 13.2 | 36 | 6 | 1006.5 | 74.2 | 13.3 | 0 | 0 | 0 | 0 | 0 | 0 | 15 |
| 16 | 18.0 | 10.5 | 9.0 | 15.0 | 7.8 | TR | SW | 7.8 | 27 | 7 | 1012.5 | 73.4 | 14.1 | 0 | 0 | 0 | 0 | 0 | 0 | 16 |
| 17 | 18.8 | 10.3 | 8.0 | 15.2 | 1.4 | 0.8 | NE | 4.7 | 20 | 7 | 1014.4 | 74.6 | 14.7 | 0 | 0 | 0 | 0 | 0 | 0 | 17 |
| 18 | 22.0 | 10.2 | 8.1 | 15.5 | 4.9 | 0.0 | SE | 2.3 | 13 | 6 | 1013.7 | 86.1 | 16.2 | 0 | 0 | 0 | 0 | 0 | 0 | 18 |
| 19 | 26.5 | 15.4 | 13.0 | 16.1 | 3.0 | 0.0 | N | 3.1 | 18 | 7 | 1013.9 | 81.8 | 19.6 | 0 | 0 | 0 | 0 | 0 | 0 | 19 |
| 20 | 21.0 | 14.3 | 12.7 | 17.4 | 3.5 | 1.4 | NE | 2.8 | 14 | 6 | 1010.8 | 89.9 | 17.1 | 0 | 0 | 0 | 0 | 0 | 0 | 20 |
| 21 | 21.4 | 14.0 | 11.7 | 17.0 | 3.8 | 1.9 | W | 6.1 | 16 | 8 | 1008.5 | 85.0 | 16.8 | 0 | 0 | 0 | 0 | 0 | 0 | 21 |
| 22 | 17.1 | 11.1 | 10.5 | 16.8 | 0.9 | 3.2 | S | 10.6 | 29 | 8 | 1004.1 | 85.6 | 14.1 | 0 | 0 | 0 | 0 | 0 | 0 | 22 |
| 23 | 18.9 | 12.1 | 10.5 | 16.2 | 4.0 | 1.1 | W | 15.4 | 43 | 7 | 1007.5 | 78.5 | 14.6 | 0 | 0 | 0 | 0 | 0 | 0 | 23 |
| 24 | 16.6 | 10.4 | 8.7 | 16.3 | 2.5 | 0.0 | W | 7.8 | 23 | 8 | 1020.9 | 72.8 | 12.6 | 0 | 0 | 0 | 0 | 0 | 0 | 24 |
| 25 | 20.8 | 7.6 | 4.6 | 15.4 | 9.9 | 0.0 | NW | 3.9 | 16 | 1 | 1027.9 | 68.7 | 14.1 | 0 | 0 | 0 | 0 | 0 | 0 | 25 |
| 26 | 22.5 | 10.4 | 7.5 | 16.2 | 6.9 | 0.0 | NW | 4.7 | 21 | 5 | 1028.7 | 70.3 | 15.8 | 0 | 0 | 0 | 0 | 0 | 0 | 26 |
| 27 | 19.4 | 11.2 | 9.1 | 17.1 | 2.1 | 1.9 | W | 5.6 | 22 | 6 | 1024.8 | 82.2 | 14.3 | 0 | 0 | 0 | 0 | 0 | 0 | 27 |
| 28 | 20.0 | 11.7 | 11.5 | 17.0 | 0.3 | 2.4 | W | 8.2 | 27 | 8 | 1018.0 | 94.6 | 15.3 | 0 | 0 | 0 | 0 | 0 | 0 | 28 |
| 29 | 20.5 | 10.6 | 9.5 | 16.8 | 5.0 | 0.0 | N | 6.1 | 28 | 7 | 1021.7 | 70.8 | 15.7 | 0 | 0 | 0 | 0 | 0 | 0 | 29 |
| 30 | 25.8 | 14.9 | 12.8 | 17.4 | 12.6 | 0.0 | SW | 9.5 | 31 | 2 | 1019.5 | 71.4 | 18.9 | 0 | 0 | 0 | 0 | 0 | 0 | 30 |
| Total/Mean | 19.7 | 9.9 | 7.9 | 15.8 | 177.7 | 17.0 | X | 7.0 | X | 5.7 | 1017.5 | 78.1 | 14.3 | 0 | 0 | 0 | 0 | 0 | 0 | Total/Mean |
| *Diff./% | -0.5 | -0.9 | 97% | 36% | *Diff./% | |||||||||||||||
| Date | Max. Temp. (°C) 09/09h | Min. Temp. (°C) 09/09h | Grass Min. Temp. (°C) 21/09h | Earth (30cms) Temp. (°C) 09h | Sun (Hours) 00/00h | R'fall (MM) 09/09h | Wind Dir'n 09h | Mean Wind Speed (MPH) 00/00h | Max. Gust Speed (MPH) 00/00h | Cloud Cover (Oktas) 09h | Mean MSL Air Pressure (mB) 00/00h | Mean Rel. Humd. (%) 00/00h | Mean Temp. (°C) 00/00h | Fog (vis. <1000m @ 09h) | Fog (vis. <200m @ 09h) | Snow or Rain and Snow 00/00h | Snow Lying @ 09h (>50% cover) | Hail 00/00h | Thunder 00/00h | Date |
Differences from average:
Differences from average shown in red. Reference periods used are as follows: Temperature 30 Years 1981/2010; rainfall 30 Years 1981/2010; sunshine 30 Years 1981/2010.
(*The differences from average quoted during the course of the month relate to the cumulative daily averages up to the date of the last observation, not the averages for the month as a whole)
Additional Data:
Rainfall Duration N/A
Air Frost Duration 0.0 hours
Graphs and Charts:
Click on the following links to view this month's graphs and charts.....
1. Daily Maximum, Minimum & Grass Minimum Temperatures
2. Daily Maximum & Minimum Temperatures (with 30 Year Comparative Means)
3. Daily Earth (30 cms Depth) Temperature @ 0900 GMT 4. Daily Rainfall 5. Daily Sunshine
6. Daily Maximum Gust & Mean Wind Speed 7. Daily Wind Direction @ 0900 GMT
8. Daily Mean MSL Air Pressure 9. Daily Mean Relative Humidity 10. Thermograph
11. Barograph 12. Hygrograph 13. Anemograph 14. Wind Direction
15. Rainfall Intensity & Duration
June 2013 Weather Review:
......and click on the link below for a text report of the June 2013 weather in Royston
June (since 1972) at Royston (Iceni) Weather Station:
Mean daily maximum temperature (30 years 1981/2010) 20.2°C
Mean daily minimum temperature (30 years 1981/2010) 10.8°C
Highest temperature 33.7°C (26th June 1976); lowest temperature 2.2°C (3rd June 1975)
Lowest grass minimum temperature -1.0°C (2nd June 1991)
Warmest June 1976 (Mean temperature 18.3°C); coldest June 1977 (Mean temperature 12.5°C)
Average June rainfall (30 years 1981/2010) 47.8 mm
Wettest June 1985 (Rainfall 135.4 mm); driest June 1996 (Rainfall 8.0 mm)
Wettest Day 19th June 1973 (Rainfall 36.8 mm);
Highest number of "rain days" (0.2 mm or more) 23 (1997); lowest number of "rain days" 3 (1976, 1996)
Highest number of days with thunder 10 (1982)
Highest number of air frosts 0
Highest number of ground frosts 2 (1989)
Highest number of days with snow falling 1 (1975)
Highest number of days with snow lying (ground with more than 50% snow cover @ 0900 GMT) 0
|
|
|
|
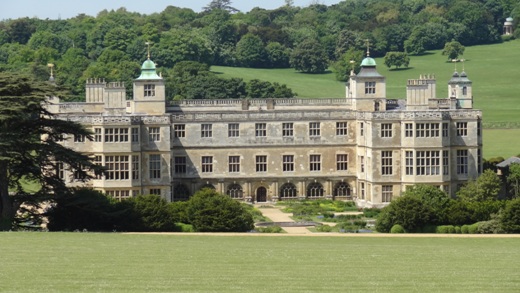
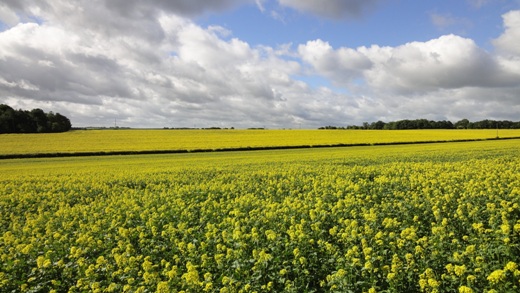
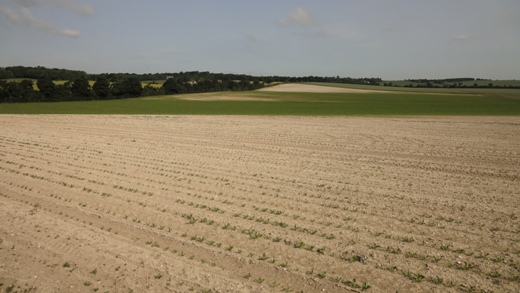
| A distance of 17 km ESE of Royston this is one of England's grandest stately homes, Audley End House, near Saffron Walden. Originally the site of a Benedictine monastery (Walden Abbey), the present house is largely an early 17th century country house built primarily for entertaining royalty (King James I) and has been much modified over the years. The present house includes a Victorian service wing containing a kitchen, laundries and dairy. Live demonstrations are occasionally given in these facilities, whilst at other times visitors can experience an impression of the duties of the staff in Victorian times through video projections on the walls with accompanying sound. In this view as seen at 1055 GMT on 7th June 2013 the eastern elevation is featured together with the formal gardens (the Parterre) and part of the parkland which rises up to the Temple of Concord. The parkland in the foreground is the site of open air concerts, which have attracted many well known artists, the gently rising ground making an excellent venue for spectators. On a meteorological note the residents of the House would never have been in any doubt as to the wind direction as the roof has no less than eight gold coloured wind vanes! The photograph indicates a fair early Summer's day and at Royston a maximum temperature of 22.6°C and sunshine of 13.7 hours were recorded. | Just as the colour intensity of the oil seed rape starts to wane, along comes the mustard! This photograph was taken on the Burloes estate, Royston at 0813 GMT on 15th June 2013 and shows a large acreage of mustard in the foreground whilst beyond the hedge in the middle distance is part of an equally large area of oil seed rape. Just 5 weeks previously the mustard was only at seedling stage and in the short ensuing period has rapidly grown to a height of 1.5 metres and burst in to flower. Although the oil seed rape is exhibiting a solid display of colour at this time it is, in fact, just past its maximum flowering and within 10 days the seed pods had taken over and the colour all but disappeared. Two further fields of mustard are growing nearby giving the estate a spectacular veneer. The temperature at this time was 12.5°C, later rising to a maximum of 17.6°C, not a particularly impressive value given that it was 3.0°C below the 30 Year (1981/2010) average maximum temperature for 15th June. The preceding night minimum temperature of 10.3°C was actually 0.5°C above the 30 Year average, however. The build up of early morning cloud as illustrated in the picture did not prevent a sunshine accumulation for the day of 9.1 hours, compared with an average of about 6 hours for a June day. Only 22.4 hours sunshine had been recorded in the previous 7 days. | As the A505 and B1039 roads diverge from Royston in ENE and SE directions respectively large tracts of arable land are encompassed within their boundaries. In this picture taken at 0803 GMT on 25th June 2013 from the B1039 road about 2.5 km SE of Royston one such large area of arable land under cultivation is featured. The soil in this field appears very dry as a result of the very dry June to date and the sugar beet seedlings in view have been struggling against these adverse conditions, whilst the green band in the middle distance indicates slightly less dry conditions giving larger plant sizes in this area. In any event the crop got off to a rather slow start due to the coldest Spring since records began at Royston (Iceni) Weather Station in 1972. Rainfall in June to 25th was only 12.7 millimetres, which is only one-third of the 30 Year (1981/2010) average for this period. A WNW breeze of 4 knots gusting to 7 knots is drifting across the landscape at this time in a temperature of 13.2°C. The temperature later rose to a maximum of 20.8°C after an overnight minimum of 7.6°C. Sunshine for the day was 9.9 hours. After a first week of June which yielded an exceptionally high sunshine total of 77.6 hours, sunshine subsequently had been at a premium and 25th was one of the few sunny days since then as the cumulative sunshine total for the month gradually drifted below average. |
Return to Welcome to Royston (Iceni) Weather Station page
(This page last updated 10th July 2013 1952 GMT)