Royston (Iceni) Weather Station
Daily Weather Observations - March 2013
(All Times GMT)
| Date | Max. Temp. (°C) 09/09h | Min. Temp. (°C) 09/09h | Grass Min. Temp. (°C) 21/09h | Earth (30cms) Temp. (°C) 09h | Sun (Hours) 00/00h | R'fall (MM) 09/09h | Wind Dir'n 09h | Mean Wind Speed (MPH) 00/00h | Max. Gust Speed (MPH) 00/00h | Cloud Cover (Oktas) 09h | Mean MSL Air Pressure (mB) 00/00h | Mean Rel. Humd. (%) 00/00h | Mean Temp. (°C) 00/00h | Fog (vis. <1000m @ 09h) | Fog (vis. <200m @ 09h) | Snow or Rain and Snow 00/00h | Snow Lying @ 09h (>50% cover) | Hail 00/00h | Thunder 00/00h | Date |
| 1 | 6.0 | 1.7 | 1.4 | 4.1 | 0.0 | 0.1 | NE | 4.8 | 21 | 8 | 1029.1 | 86.2 | 4.0 | 0 | 0 | 0 | 0 | 0 | 0 | 1 |
| 2 | 4.2 | 1.3 | 0.2 | 4.5 | 1.4 | 0.0 | NE | 2.0 | 9 | 8 | 1026.9 | 84.7 | 2.0 | 0 | 0 | 0 | 0 | 0 | 0 | 2 |
| 3 | 8.3 | -2.1 | -7.0 | 4.0 | 1.9 | 0.0 | NE | 2.1 | 14 | 7 | 1023.0 | 84.7 | 2.8 | 0 | 0 | 0 | 0 | 0 | 0 | 3 |
| 4 | 10.5 | 0.6 | -4.4 | 4.3 | 7.8 | 0.0 | E | 3.8 | 15 | 6 | 1013.3 | 79.6 | 4.5 | 0 | 0 | 0 | 0 | 0 | 0 | 4 |
| 5 | 15.7 | -0.5 | -4.7 | 4.4 | 10.3 | TR | SE | 3.3 | 13 | 0 | 1003.8 | 80.2 | 7.3 | 0 | 0 | 0 | 0 | 0 | 0 | 5 |
| 6 | 11.5 | 3.6 | 1.1 | 4.9 | 0.0 | 2.4 | SW | 1.9 | 11 | 8 | 1000.7 | 87.8 | 7.3 | 0 | 0 | 0 | 0 | 0 | 0 | 6 |
| 7 | 9.4 | 5.3 | 4.4 | 5.6 | 0.0 | 3.3 | E | 1.9 | 11 | 8 | 996.8 | 97.8 | 7.1 | 1 | 0 | 0 | 0 | 0 | 0 | 7 |
| 8 | 8.7 | 7.0 | 6.4 | 6.2 | 0.0 | 2.6 | E | 2.5 | 10 | 8 | 997.4 | 99.6 | 7.5 | 1 | 1 | 0 | 0 | 0 | 0 | 8 |
| 9 | 5.2 | 4.0 | 4.1 | 6.4 | 0.0 | 4.0 | N | 5.0 | 15 | 8 | 1002.0 | 97.7 | 4.1 | 0 | 0 | 0 | 0 | 0 | 0 | 9 |
| 10 | 1.3 | 0.0 | -0.3 | 6.0 | 0.0 | 0.6 | NE | 6.2 | 21 | 8 | 1006.3 | 94.0 | 0.5 | 0 | 0 | 1 | 1 | 0 | 0 | 10 |
| 11 | 0.7 | -2.0 | -3.8 | 4.9 | 0.8 | 0.1 | NE | 10.7 | 31 | 7 | 1008.6 | 77.3 | -1.4 | 0 | 0 | 1 | 0 | 1 | 0 | 11 |
| 12 | 4.6 | -3.9 | -6.1 | 4.0 | 5.3 | TR | NE | 9.0 | 29 | 2 | 1009.4 | 74.9 | 0.0 | 0 | 0 | 1 | 0 | 0 | 0 | 12 |
| 13 | 6.5 | -1.4 | -5.6 | 3.7 | 5.3 | 0.3 | N | 5.6 | 24 | 1 | 1010.0 | 86.1 | 1.2 | 0 | 0 | 1 | 0 | 0 | 0 | 13 |
| 14 | 8.2 | -3.5 | -8.2 | 3.8 | 7.8 | 2.5 | W | 4.2 | 14 | 0 | 1014.4 | 78.3 | 1.5 | 0 | 0 | 0 | 0 | 0 | 0 | 14 |
| 15 | 8.7 | 1.4 | 0.5 | 4.2 | 1.8 | 4.7 | S | 11.8 | 31 | 7 | 1005.1 | 89.1 | 5.2 | 0 | 0 | 0 | 0 | 0 | 0 | 15 |
| 16 | 8.9 | 5.9 | 4.4 | 5.0 | 1.7 | 4.1 | S | 12.2 | 35 | 8 | 994.0 | 88.2 | 6.2 | 0 | 0 | 0 | 0 | 0 | 0 | 16 |
| 17 | 8.7 | 2.0 | 0.0 | 5.4 | 1.4 | 8.6 | SE | 5.9 | 27 | 8 | 989.2 | 90.4 | 4.3 | 0 | 0 | 0 | 0 | 0 | 0 | 17 |
| 18 | 7.9 | -2.0 | -6.3 | 5.4 | 5.6 | 0.1 | SW | 2.3 | 11 | 1 | 990.6 | 93.1 | 2.5 | 0 | 0 | 0 | 0 | 0 | 0 | 18 |
| 19 | 8.1 | -0.8 | -4.4 | 5.1 | 3.4 | TR | N | 1.3 | 10 | 6 | 997.2 | 88.4 | 3.3 | 0 | 0 | 0 | 0 | 0 | 0 | 19 |
| 20 | 3.4 | 0.8 | -3.6 | 5.4 | 0.0 | 0.2 | NE | 3.1 | 14 | 8 | 1006.8 | 94.0 | 2.4 | 0 | 0 | 0 | 0 | 0 | 0 | 20 |
| 21 | 5.6 | -1.6 | -6.4 | 4.9 | 4.8 | 0.4 | E | 4.5 | 23 | 1 | 1016.0 | 80.8 | 2.3 | 0 | 0 | 0 | 0 | 0 | 0 | 21 |
| 22 | 4.8 | 1.0 | -0.1 | 5.0 | 0.1 | 5.7 | E | 8.6 | 34 | 8 | 1010.7 | 82.3 | 2.6 | 0 | 0 | 1 | 0 | 0 | 0 | 22 |
| 23 | 0.5 | -0.2 | -0.4 | 4.9 | 0.0 | 5.7 | E | 6.1 | 21 | 8 | 1011.0 | 94.0 | 0.4 | 1 | 0 | 1 | 1 | 0 | 0 | 23 |
| 24 | 0.5 | -1.8 | -0.6 | 4.1 | 0.0 | 0.4 | NE | 7.3 | 28 | 8 | 1013.9 | 86.2 | -0.8 | 0 | 0 | 1 | 1 | 0 | 0 | 24 |
| 25 | 1.0 | -1.0 | -2.4 | 3.9 | 0.1 | 0.0 | NE | 7.9 | 25 | 8 | 1015.1 | 76.4 | 0.0 | 0 | 0 | 0 | 1 | 0 | 0 | 25 |
| 26 | 1.9 | -0.9 | -2.4 | 3.5 | 0.1 | 0.0 | NE | 6.5 | 2.6 | 8 | 1013.9 | 75.1 | 0.1 | 0 | 0 | 0 | 1 | 0 | 0 | 26 |
| 27 | 3.0 | -2.7 | -6.0 | 3.4 | 0.7 | 0.0 | NE | 4.6 | 17 | 7 | 1011.9 | 75.7 | 0.2 | 0 | 0 | 0 | 1 | 0 | 0 | 27 |
| 28 | 4.2 | -4.0 | -8.5 | 3.3 | 3.6 | TR | NE | 3.7 | 19 | 4 | 1012.4 | 76.4 | 0.0 | 0 | 0 | 0 | 0 | 0 | 0 | 28 |
| 29 | 4.5 | -3.2 | -8.6 | 3.1 | 3.2 | TR | NE | 3.3 | 18 | 2 | 1010.7 | 74.5 | 0.8 | 0 | 0 | 1 | 0 | 0 | 0 | 29 |
| 30 | 6.6 | -1.0 | -2.4 | 3.4 | 3.3 | TR | NE | 4.4 | 22 | 7 | 1011.5 | 77.6 | 1.5 | 0 | 0 | 1 | 0 | 0 | 0 | 30 |
| 31 | 4.5 | -3.8 | -9.1 | 3.9 | 3.6 | TR | NE | 2.6 | 15 | 6 | 1014.3 | 77.0 | 0.6 | 0 | 0 | 1 | 0 | 0 | 0 | 31 |
| Total/Mean | 5.9 | -0.1 | -2.5 | 4.5 | 73.9 | 45.8 | X | 5.1 | X | 5.9 | 1008.6 | 84.8 | 2.6 | 3 | 1 | 10 | 6 | 1 | 0 | Total/Mean |
| *Diff./% | -4.8 | -3.7 | 64% | 116% | *Diff./% | |||||||||||||||
| Date | Max. Temp. (°C) 09/09h | Min. Temp. (°C) 09/09h | Grass Min. Temp. (°C) 21/09h | Earth (30cms) Temp. (°C) 09h | Sun (Hours) 00/00h | R'fall (MM) 09/09h | Wind Dir'n 09h | Mean Wind Speed (MPH) 00/00h | Max. Gust Speed (MPH) 00/00h | Cloud Cover (Oktas) 09h | Mean MSL Air Pressure (mB) 00/00h | Mean Rel. Humd. (%) 00/00h | Mean Temp. (°C) 00/00h | Fog (vis. <1000m @ 09h) | Fog (vis. <200m @ 09h) | Snow or Rain and Snow 00/00h | Snow Lying @ 09h (>50% cover) | Hail 00/00h | Thunder 00/00h | Date |
Differences from average:
Differences from average shown in red. Reference periods used are as follows: Temperature 30 Years 1981/2010; rainfall 30 Years 1981/2010; sunshine 30 Years 1981/2010.
(*The differences from average quoted during the course of the month relate to the cumulative daily averages up to the date of the last observation, not the averages for the month as a whole)
Additional Data:
Rainfall Duration N/A
Air Frost Duration 178.7 hours
Graphs and Charts:
Click on the following links to view this month's graphs and charts.....
1. Daily Maximum, Minimum & Grass Minimum Temperatures
2. Daily Maximum & Minimum Temperatures (with 30 Year Comparative Means)
3. Daily Earth (30 cms Depth) Temperature @ 0900 GMT 4. Daily Rainfall 5. Daily Sunshine
6. Daily Maximum Gust & Mean Wind Speed 7. Daily Wind Direction @ 0900 GMT
8. Daily Mean MSL Air Pressure 9. Daily Mean Relative Humidity 10. Thermograph
11. Barograph 12. Hygrograph 13. Anemograph 14. Wind Direction
15. Rainfall Intensity & Duration
March 2013 Weather Review:
......and click on the link below for a text report of the March 2013 weather in Royston
March (since 1973) at Royston (Iceni) Weather Station:
Mean day maximum temperature (30 years 1981/2010) 10.7°C
Mean night minimum temperature (30 years 1981/2010) 3.6°C
Highest temperature 21.6°C (17th March 1990; 28th March 2012); lowest temperature -6.6°C (3rd March 1986)
Lowest grass minimum temperature -13.7°C (3rd March 1986)
Warmest March 1997 (Mean temperature 9.1°C); coldest March 1987 (Mean temperature 4.3°C)
Average March rainfall (30 years 1981/2010) 39.4 mm
Wettest March 1979 (Rainfall 97.8 mm); driest March 2011 (Rainfall 4.4 mm)
Wettest Day 2nd March 1995 (Rainfall 30.1 mm);
Highest number of "rain days" (0.2 mm or more) 25 (1981); lowest number of "rain days" 3 (2003)
Highest number of days with thunder 2 (1986, 1995)
Highest number of air frosts 15 (1987)
Highest number of ground frosts 21 (1987)
Highest number of days with snow falling 11 (1979)
Highest number of days with snow lying (ground with more than 50% snow cover @ 0900 GMT) 4 (1986)
|
|
|
|
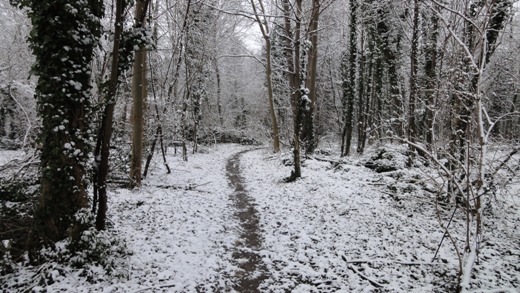
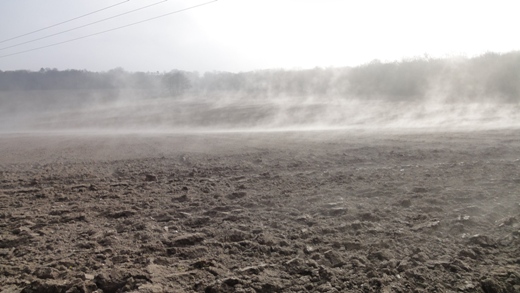
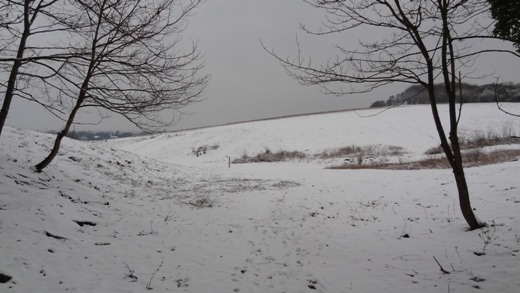
| On 10th March 2013 the British Isles was situated between an anticyclone centred over Iceland and a depression over Biscay giving rise to a cold north-easterly flow over most areas. A southward moving cold front resulted in Royston experiencing a light early morning snowfall giving a level depth of 1cm at 0900 GMT. Much of this snowfall readily adhered to trees and other vegetation giving a picture postcard effect, and in this photograph the ancient Icknield Way Trail is shown as it climbs out of Royston over the southern spur of Hyde Hill and onward into south Cambridgeshire, Essex, Suffolk and Norfolk. At this point the Icknield Way is close to the A505 road but diverges from it a few hundred metres to the east. This was a particularly cold day for March with the maximum temperature of 1.3°C being 9.3°C below the 30 Year (1981/2010) average for this day. The temperature at the time of the photograph (0805 GMT) was 0.5°C, the lack of any sunshine during the day being an obvious factor contributing to the unduly depressed maximum temperature. | Arctic sea smoke comes to Royston! Not quite perhaps but a similar phenomenon is visible in this picture taken at 0923 GMT on 19th March 2013 just to the east of Royston. Arctic sea smoke occurs in polar and arctic regions when cold air passes over warmer water but is unable to absorb the attendant rising moisture which then immediately condenses into fog. In this scene the surface of this newly ploughed field is being heated by the early morning sunshine and evaporation is taking place into the cold air above, the rising currents of air condensing into fog which is swirling around in the light air from the NNE. This field was late in going under the plough as over-wintering sheep have only just left after eating the green crop sown after last summer's harvest. Similar recently ploughed 'sheep' fields (but not other fields with a different surface texture) nearby were also exhibiting this phenomenon giving the impression of a 'steaming' countryside. A maximum temperature of 8.1°C was achieved later that day whilst sunshine of 3.4 hours was recorded. | It may be Spring, and the sun may have crossed the Equator on its northward migration to the Tropic of Cancer, but Royston is still in the grip of Winter on 23rd March 2013 when this photograph was taken on Therfield Heath (at 1127 GMT). The exact location is close to the tree belt on the southern boundary of the Heath at its eastern end, looking northwards along a dry valley towards the apron of lower ground adjacent to the Baldock Road. An overnight snowfall has given a 7 cm level cover depth at 0900 GMT as weather fronts from the SW try to advance into very cold air flowing off the European continent. Light snow was falling at this time, but a little later an easterly blizzard was sweeping the Heath, making the higher ground an unforgiving place in these conditions! The maximum temperature on 23rd was only 0.5°C, this being 11.3°C below the 30 Year (1981/2010) average for this day. Up to this point in March both day maximum and night minimum temperatures were running some 3°C below average, whilst a 40% deficiency in sunshine had been registered. |
Return to Welcome to Royston (Iceni) Weather Station page
(This page last updated 10th April 2013 2044 GMT)