Royston (Iceni) Weather Station
Daily Weather Observations - December 2012
(All Times GMT)
| Date | Max. Temp. (°C) 09/09h | Min. Temp. (°C) 09/09h | Grass Min. Temp. (°C) 21/09h | Earth (30cms) Temp. (°C) 09h | Sun (Hours) 00/00h | R'fall (MM) 09/09h | Wind Dir'n 09h | Mean Wind Speed (MPH) 00/00h | Max. Gust Speed (MPH) 00/00h | Cloud Cover (Oktas) 09h | Mean MSL Air Pressure (mB) 00/00h | Mean Rel. Humd. (%) 00/00h | Mean Temp. (°C) 00/00h | Fog (vis. <1000m @ 09h) | Fog (vis. <200m @ 09h) | Snow or Rain and Snow 00/00h | Snow Lying @ 09h (>50% cover) | Hail 00/00h | Thunder 00/00h | Date |
| 1 | 4.0 | -1.7 | -6.0 | 5.0 | 0.0 | TR | SW | 6.9 | 26 | 8 | 1013.2 | 91.8 | 0.8 | 0 | 0 | 0 | 0 | 0 | 0 | 1 |
| 2 | 8.5 | -2.1 | -4.9 | 4.5 | 6.7 | 4.4 | W | 6.0 | 16 | 0 | 1015.1 | 89.0 | 0.2 | 0 | 0 | 0 | 0 | 0 | 0 | 2 |
| 3 | 8.6 | 1.6 | 0.5 | 4.0 | 2.0 | 3.5 | W | 9.4 | 31 | 7 | 1005.4 | 93.4 | 4.9 | 0 | 0 | 0 | 0 | 0 | 0 | 3 |
| 4 | 6.1 | 1.9 | -0.5 | 4.3 | 2.1 | 5.5 | W | 9.3 | 26 | 6 | 1001.6 | 87.6 | 3.5 | 0 | 0 | 0 | 0 | 0 | 0 | 4 |
| 5 | 2.7 | 0.1 | -3.1 | 4.3 | 4.6 | 0.0 | NW | 5.6 | 20 | 8 | 1007.4 | 90.6 | 0.7 | 0 | 0 | 1 | 1 | 0 | 0 | 5 |
| 6 | 4.2 | -3.0 | -7.8 | 4.0 | 0.0 | 3.8 | SW | 8.7 | 33 | 7 | 1011.2 | 86.8 | 0.0 | 0 | 0 | 0 | 1 | 0 | 0 | 6 |
| 7 | 5.2 | 1.4 | -0.4 | 3.9 | 0.7 | 0.2 | W | 12.0 | 34 | 8 | 1000.8 | 88.8 | 3.6 | 0 | 0 | 1 | 0 | 0 | 0 | 7 |
| 8 | 7.0 | 1.0 | -2.4 | 4.4 | 5.0 | 0.1 | W | 5.5 | 24 | 8 | 1022.2 | 90.4 | 3.5 | 1 | 1 | 0 | 0 | 0 | 0 | 8 |
| 9 | 8.8 | 4.4 | 3.1 | 4.5 | 2.4 | 0.0 | W | 12.2 | 36 | 4 | 1016.7 | 84.5 | 6.1 | 0 | 0 | 0 | 0 | 0 | 0 | 9 |
| 10 | 5.1 | 0.2 | -2.0 | 4.5 | 3.4 | 0.0 | NW | 6.4 | 20 | 3 | 1021.6 | 88.8 | 1.8 | 0 | 0 | 0 | 0 | 0 | 0 | 10 |
| 11 | -0.2 | -2.5 | -7.0 | 3.9 | 0.2 | 0.0 | N | 3.1 | 9 | 2 | 1028.8 | 95.8 | -1.6 | 0 | 0 | 0 | 0 | 0 | 0 | 11 |
| 12 | 1.8 | -7.0 | -9.6 | 3.5 | 4.3 | 0.0 | W | 3.3 | 14 | 2 | 1019.2 | 93.4 | -2.1 | 0 | 0 | 0 | 0 | 0 | 0 | 12 |
| 13 | 4.7 | -5.1 | -9.3 | 3.1 | 1.3 | 0.0 | S | 1.4 | 14 | 0 | 1005.2 | 91.6 | -2.0 | 0 | 0 | 0 | 0 | 0 | 0 | 13 |
| 14 | 9.2 | -0.4 | -0.9 | 3.0 | 0.0 | 7.8 | SE | 9.7 | 43 | 8 | 984.4 | 96.1 | 5.0 | 0 | 0 | 0 | 0 | 0 | 0 | 14 |
| 15 | 10.5 | 5.7 | 3.5 | 3.6 | 5.2 | 3.8 | S | 9.2 | 27 | 1 | 989.8 | 90.4 | 7.4 | 0 | 0 | 0 | 0 | 0 | 0 | 15 |
| 16 | 9.3 | 4.4 | 2.4 | 4.3 | 6.0 | 0.1 | SW | 7.5 | 18 | 3 | 998.1 | 92.3 | 5.9 | 0 | 0 | 0 | 0 | 0 | 0 | 16 |
| 17 | 8.5 | 4.5 | 2.3 | 4.4 | 5.2 | 0.2 | SW | 8.5 | 20 | 5 | 999.9 | 90.1 | 6.0 | 0 | 0 | 0 | 0 | 0 | 0 | 17 |
| 18 | 7.0 | 3.9 | -0.3 | 4.5 | 1.1 | 0.0 | NW | 4.9 | 19 | 5 | 1013.7 | 93.0 | 5.6 | 0 | 0 | 0 | 0 | 0 | 0 | 18 |
| 19 | 6.3 | 1.8 | -1.5 | 4.5 | 0.0 | 18.5 | SE | 5.7 | 26 | 8 | 1016.1 | 95.6 | 4.5 | 0 | 0 | 0 | 0 | 0 | 0 | 19 |
| 20 | 8.3 | 5.3 | 4.8 | 5.0 | 0.0 | 3.1 | SE | 8.2 | 28 | 8 | 1001.7 | 98.4 | 6.5 | 0 | 0 | 0 | 0 | 0 | 0 | 20 |
| 21 | 9.0 | 6.4 | 4.5 | 5.5 | 3.3 | 6.2 | SW | 7.8 | 20 | 4 | 1008.0 | 92.9 | 7.0 | 0 | 0 | 0 | 0 | 0 | 0 | 21 |
| 22 | 13.1 | 5.4 | 3.9 | 5.6 | 0.0 | 9.9 | SE | 9.6 | 30 | 8 | 1003.3 | 97.8 | 8.9 | 0 | 0 | 0 | 0 | 0 | 0 | 22 |
| 23 | 11.3 | 10.7 | 9.1 | 6.7 | 2.5 | 6.7 | SW | 12.2 | 36 | 7 | 1001.4 | 85.9 | 10.7 | 0 | 0 | 0 | 0 | 0 | 0 | 23 |
| 24 | 11.5 | 6.7 | 6.2 | 6.9 | 0.1 | 3.6 | SE | 8.6 | 36 | 8 | 997.1 | 94.0 | 8.5 | 0 | 0 | 0 | 0 | 0 | 0 | 24 |
| 25 | 8.4 | 6.3 | 4.6 | 6.9 | 1.1 | 0.5 | S | 9.4 | 30 | 8 | 993.9 | 90.6 | 7.2 | 0 | 0 | 0 | 0 | 0 | 0 | 25 |
| 26 | 9.4 | 4.0 | 2.1 | 6.4 | 3.1 | 1.9 | S | 11.2 | 30 | 1 | 1001.7 | 90.5 | 6.6 | 0 | 0 | 0 | 0 | 0 | 0 | 26 |
| 27 | 7.5 | 5.6 | 3.4 | 6.1 | 0.1 | 3.3 | S | 9.9 | 29 | 8 | 1004.1 | 90.3 | 6.3 | 0 | 0 | 0 | 0 | 0 | 0 | 27 |
| 28 | 11.6 | 3.8 | 0.7 | 6.0 | 0.0 | 0.3 | S | 10.2 | 37 | 8 | 1014.4 | 93.8 | 8.3 | 0 | 0 | 0 | 0 | 0 | 0 | 28 |
| 29 | 11.3 | 10.2 | 8.9 | 7.0 | 0.0 | 2.1 | S | 13.8 | 41 | 7 | 1001.4 | 86.7 | 9.4 | 0 | 0 | 0 | 0 | 0 | 0 | 29 |
| 30 | 10.8 | 4.2 | 2.3 | 6.7 | 4.8 | 0.1 | SW | 14.7 | 42 | 1 | 1007.2 | 81.7 | 6.8 | 0 | 0 | 0 | 0 | 0 | 0 | 30 |
| 31 | 11.0 | 9.4 | 8.2 | 6.5 | 0.0 | 12.1 | SW | 12.8 | 39 | 8 | 1000.4 | 89.0 | 9.9 | 0 | 0 | 0 | 0 | 0 | 0 | 31 |
| Total/Mean | 7.8 | 2.8 | 0.5 | 5.0 | 64.9 | 97.7 | X | 8.5 | X | 5.5 | 1006.6 | 91.0 | 4.8 | 1 | 1 | 2 | 2 | 0 | 0 | Total/Mean |
| *Diff./% | +0.8 | -0.1 | 115% | 195% | *Diff./% | |||||||||||||||
| Date | Max. Temp. (°C) 09/09h | Min. Temp. (°C) 09/09h | Grass Min. Temp. (°C) 21/09h | Earth (30cms) Temp. (°C) 09h | Sun (Hours) 00/00h | R'fall (MM) 09/09h | Wind Dir'n 09h | Mean Wind Speed (MPH) 00/00h | Max. Gust Speed (MPH) 00/00h | Cloud Cover (Oktas) 09h | Mean MSL Air Pressure (mB) 00/00h | Mean Rel. Humd. (%) 00/00h | Mean Temp. (°C) 00/00h | Fog (vis. <1000m @ 09h) | Fog (vis. <200m @ 09h) | Snow or Rain and Snow 00/00h | Snow Lying @ 09h (>50% cover) | Hail 00/00h | Thunder 00/00h | Date |
Differences from average:
Differences from average shown in red. Reference periods used are as follows: Temperature 30 Years 1981/2010; rainfall 30 Years 1981/2010; sunshine 30 Years 1981/2010.
(*The differences from average quoted during the course of the month relate to the cumulative daily averages up to the date of the last observation, not the averages for the month as a whole)
Additional Data:
Rainfall Duration N/A
Air Frost Duration 102.2 hours
Graphs and Charts:
Click on the following links to view this month's graphs and charts.....
1. Daily Maximum, Minimum & Grass Minimum Temperatures
2. Daily Maximum & Minimum Temperatures (with 30 Year Comparative Means)
3. Daily Earth (30 cms Depth) Temperature @ 0900 GMT 4. Daily Rainfall 5. Daily Sunshine
6. Daily Maximum Gust & Mean Wind Speed 7. Daily Wind Direction @ 0900 GMT
8. Daily Mean MSL Air Pressure 9. Daily Mean Relative Humidity 10. Thermograph
11. Barograph 12. Hygrograph 13. Anemograph 14. Wind Direction
15. Rainfall Intensity & Duration
December 2012 Weather Review:
......and click on the link below for a text report of the December 2012 weather in Royston
December (since 1972) at Royston (Iceni) Weather Station:
Mean day maximum temperature (30 years 1981/2010) 7.0°C
Mean night minimum temperature (30 years 1981/2010) 2.9°C
Highest temperature 15.1°C (2nd December 1985); lowest temperature -11.0°C (20th December 2010)
Lowest grass minimum temperature -14.6°C (13th December 1981)
Warmest December 1974 (Mean temperature 7.8°C); coldest December 2010 (Mean temperature 0.2°C)
Average December rainfall (30 years 1981/2010) 50.2 mm
Wettest December 1989 (Rainfall 122.4 mm); driest December 1991 (Rainfall 10.3 mm)
Wettest Day 27th December 1979 (Rainfall 31.5 mm);
Highest number of "rain days" (0.2 mm or more) 22 (1978); lowest number of "rain days" 7 (2004)
Highest number of days with thunder 3 (1989)
Highest number of air frosts 22 (2010)
Highest number of ground frosts 25 (1981)
Highest number of days with snow falling 10 (1981, 2010)
Highest number of days with snow lying (ground with more than 50% snow cover @ 0900 GMT) 23 (1981)
|
|
|
|
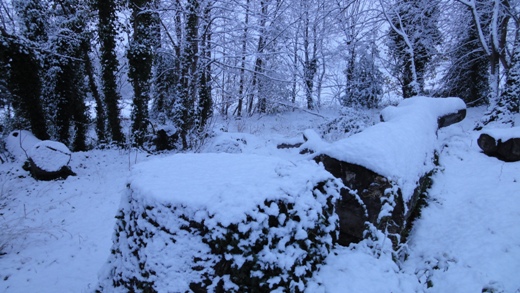
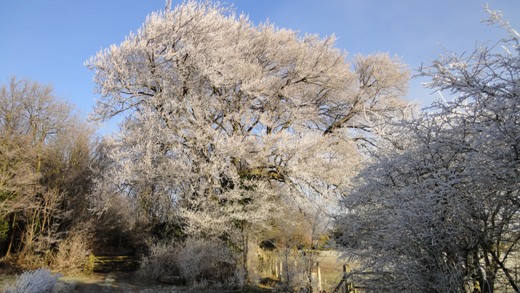
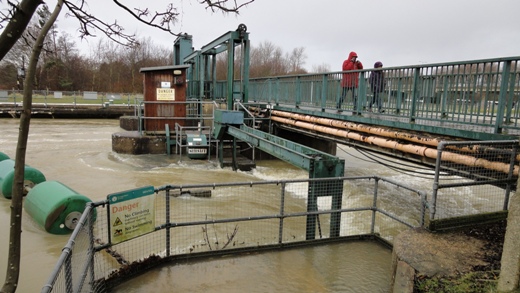
| On 5th December 2012 Royston awoke to a surprise snowfall which gave a level depth of 6 centimetres. A narrow band of precipitation moving southwards in the early hours turned to snow as it approached Royston with the town being approximately on the northern boundary of the area mainly affected, which included the south Midlands, Hertfordshire and Essex. A cold day (maximum temperature 2.7°C) and cold night (minimum temperature -3.0°C, grass minimum temperature -7.8°C) followed giving the snowfall almost 2 days before it disappeared. The picture above depicts the scene in Bury Plantation on the eastern fringe of Royston at 0758 GMT on 5th. In fairly calm conditions the snow was clinging to the branches and twigs of trees and shrubs giving a picturesque landscape. The temperature at this time was 0.4°C, after an overnight minimum of 0.1°C. A sunshine total of 4.6 hours for the day, an above average amount for a December day, was later experienced. A frosty period which lasted to mid-month then followed. | This photograph (at 0930 GMT) highlights an example of the hoar frost which covered much of the landscape around Royston on 12th December 2012. The visible effects of this frost were curiously patchy around the countryside with some swathes of trees and bushes showing little evidence of a hoar frost whilst other vegetation nearby was heavily covered as above. The location depicted here is right on the Greenwich meridian (0° longitude) which crosses the Burloes estate on the eastern side of Royston. The temperature is -5.3°C in a light WSW breeze of mean speed 4 knots gusting to 6 knots. The overnight minimum temperature was -7.0°C, a value which has often not been surpassed in the whole Winter period of previous years. The maximum temperature achieved on 12th was only 1.8°C, whilst sunshine for the day was 4.3 hours. An anticyclone over central Europe extended a ridge over southern Great Britain on this day with a small low being situated between the Shetland Isles and Norway. An Atlantic front was making slow progress into Ireland. | Since the drought conditions of 2011 and early 2012 were replaced by a much wetter regime from mid-April 2012 onwards, periods of heavy rainfall have resulted in the rivers Great Ouse and Nene to the N and NW of Royston often being in spate since then. With the ground being already saturated further heavy falls of rain in the Autumn and again this month have resulted in swollen rivers and widespread floods in the river valleys including the Great Ouse flood plain at Godmanchester (32 km NNW of Royston) which has resembled an inland sea on occasions. In this picture at Orton Staunch (65 km NNW of Royston) on 27th December 2012 at 1223 GMT there is so much water in the river Nene that the sluice gates have been completely lifted to allow free flow of water to ease pressure on the middle and upper catchments, and the normal waterfall in the foreground has consequently disappeared. Even the viewing platform in the near foreground is flooded! Exceptionally high water on both sides of the locks has resulted in serious flooding over large areas of land around Peterborough. |
Return to Welcome to Royston (Iceni) Weather Station page
(This page last updated 9th January 2013 2140 GMT)