
Royston (Iceni) Weather Station
Daily Weather Observations - November 2012
(All Times GMT)
| Date | Max. Temp. (°C) 09/09h | Min. Temp. (°C) 09/09h | Grass Min. Temp. (°C) 21/09h | Earth (30cms) Temp. (°C) 09h | Sun (Hours) 00/00h | R'fall (MM) 09/09h | Wind Dir'n 09h | Mean Wind Speed (MPH) 00/00h | Max. Gust Speed (MPH) 00/00h | Cloud Cover (Oktas) 09h | Mean MSL Air Pressure (mB) 00/00h | Mean Rel. Humd. (%) 00/00h | Mean Temp. (°C) 00/00h | Fog (vis. <1000m @ 09h) | Fog (vis. <200m @ 09h) | Snow or Rain and Snow 00/00h | Snow Lying @ 09h (>50% cover) | Hail 00/00h | Thunder 00/00h | Date |
| 1 | 9.8 | 5.5 | 4.9 | 9.5 | 2.6 | 0.8 | SW | 6.9 | 31 | 7 | 978.1 | 90.8 | 6.3 | 0 | 0 | 0 | 0 | 0 | 0 | 1 |
| 2 | 9.9 | 2.8 | 1.0 | 8.8 | 6.6 | 0.0 | SW | 9.2 | 26 | 1 | 989.5 | 84.8 | 5.4 | 0 | 0 | 0 | 0 | 0 | 0 | 2 |
| 3 | 7.9 | 3.2 | 1.3 | 8.0 | 4.0 | 4.3 | S | 8.1 | 30 | 5 | 995.0 | 84.7 | 5.1 | 0 | 0 | 0 | 0 | 0 | 0 | 3 |
| 4 | 5.5 | 2.6 | -1.0 | 7.5 | 0.0 | 9.0 | NE | 5.7 | 24 | 8 | 993.5 | 94.7 | 4.6 | 0 | 0 | 0 | 0 | 0 | 0 | 4 |
| 5 | 9.1 | 1.1 | -1.5 | 7.5 | 7.0 | 0.1 | NW | 3.3 | 18 | 1 | 1006.0 | 92.4 | 4.2 | 0 | 0 | 0 | 0 | 0 | 0 | 5 |
| 6 | 9.0 | 1.4 | -2.4 | 6.8 | 3.4 | 1.0 | W | 8.4 | 25 | 1 | 1018.7 | 92.3 | 5.6 | 0 | 0 | 0 | 0 | 0 | 0 | 6 |
| 7 | 10.6 | 5.1 | 2.7 | 7.2 | 6.3 | TR | W | 8.8 | 23 | 0 | 1022.4 | 88.7 | 7.7 | 0 | 0 | 0 | 0 | 0 | 0 | 7 |
| 8 | 12.5 | 7.9 | 5.8 | 7.5 | 4.5 | 0.0 | SW | 7.8 | 25 | 2 | 1017.3 | 83.7 | 9.3 | 0 | 0 | 0 | 0 | 0 | 0 | 8 |
| 9 | 11.0 | 6.6 | 4.1 | 8.0 | 1.7 | 4.7 | S | 6.1 | 22 | 7 | 1008.2 | 83.3 | 8.5 | 0 | 0 | 0 | 0 | 0 | 0 | 9 |
| 10 | 9.2 | 7.2 | 5.6 | 8.3 | 0.1 | 0.1 | E | 4.9 | 16 | 8 | 996.6 | 92.1 | 7.9 | 0 | 0 | 0 | 0 | 0 | 0 | 10 |
| 11 | 9.8 | 3.0 | 0.2 | 8.0 | 7.5 | 0.0 | W | 5.7 | 16 | 1 | 1010.6 | 88.5 | 5.6 | 0 | 0 | 0 | 0 | 0 | 0 | 11 |
| 12 | 11.7 | 4.3 | 1.5 | 7.1 | 0.0 | 1.3 | S | 8.1 | 24 | 8 | 1019.4 | 92.5 | 8.3 | 0 | 0 | 0 | 0 | 0 | 0 | 12 |
| 13 | 15.1 | 9.4 | 7.5 | 8.1 | 5.3 | 0.0 | S | 7.1 | 21 | 5 | 1024.8 | 87.8 | 11.9 | 0 | 0 | 0 | 0 | 0 | 0 | 13 |
| 14 | 12.4 | 9.5 | 6.0 | 9.0 | 5.3 | 0.1 | SE | 3.0 | 15 | 6 | 1025.8 | 91.9 | 9.7 | 0 | 0 | 0 | 0 | 0 | 0 | 14 |
| 15 | 8.2 | 5.1 | 3.2 | 8.7 | 1.2 | 0.0 | SE | 1.2 | 8 | 8 | 1021.9 | 95.1 | 6.7 | 1 | 1 | 0 | 0 | 0 | 0 | 15 |
| 16 | 11.8 | 5.8 | 5.2 | 8.6 | 0.1 | 0.4 | S | 3.8 | 20 | 8 | 1013.7 | 94.5 | 6.8 | 0 | 0 | 0 | 0 | 0 | 0 | 16 |
| 17 | 10.8 | 7.8 | 7.5 | 8.8 | 0.1 | 0.0 | S | 5.8 | 21 | 8 | 1006.7 | 96.0 | 8.8 | 0 | 0 | 0 | 0 | 0 | 0 | 17 |
| 18 | 8.6 | 1.9 | -1.8 | 8.4 | 7.0 | 0.0 | SW | 3.9 | 13 | 0 | 1013.7 | 88.3 | 4.0 | 0 | 0 | 0 | 0 | 0 | 0 | 18 |
| 19 | 12.1 | 1.8 | -2.1 | 6.9 | 0.6 | 1.4 | S | 8.7 | 29 | 7 | 1009.5 | 87.3 | 6.9 | 0 | 0 | 0 | 0 | 0 | 0 | 19 |
| 20 | 13.6 | 9.9 | 8.5 | 7.9 | 0.1 | 7.8 | S | 9.7 | 32 | 8 | 1007.0 | 93.7 | 11.5 | 0 | 0 | 0 | 0 | 0 | 0 | 20 |
| 21 | 11.0 | 8.7 | 7.5 | 8.9 | 0.0 | 6.3 | SE | 6.5 | 31 | 8 | 1006.5 | 96.5 | 8.2 | 0 | 0 | 0 | 0 | 0 | 0 | 21 |
| 22 | 12.8 | 5.3 | 3.7 | 8.4 | 1.5 | 8.0 | S | 13.6 | 44 | 6 | 1008.9 | 85.8 | 10.2 | 0 | 0 | 0 | 0 | 0 | 0 | 22 |
| 23 | 9.5 | 4.9 | 3.2 | 8.5 | 6.9 | 0.1 | S | 7.3 | 23 | 3 | 1010.5 | 92.4 | 6.6 | 0 | 0 | 0 | 0 | 0 | 0 | 23 |
| 24 | 11.6 | 3.4 | -0.9 | 7.4 | 0.0 | 13.1 | S | 4.7 | 23 | 8 | 1009.6 | 97.2 | 6.5 | 0 | 0 | 0 | 0 | 0 | 0 | 24 |
| 25 | 9.9 | 6.1 | 4.5 | 7.9 | 5.6 | 2.6 | SW | 13.5 | 46 | 1 | 999.4 | 88.0 | 8.7 | 0 | 0 | 0 | 0 | 0 | 0 | 25 |
| 26 | 9.9 | 7.2 | 6.0 | 7.9 | 1.7 | 5.9 | S | 3.9 | 19 | 7 | 997.3 | 91.7 | 8.1 | 0 | 0 | 0 | 0 | 0 | 0 | 26 |
| 27 | 7.5 | 6.7 | 6.2 | 8.1 | 0.0 | 4.1 | N | 7.1 | 27 | 8 | 1003.6 | 97.3 | 6.5 | 0 | 0 | 0 | 0 | 0 | 0 | 27 |
| 28 | 5.8 | 4.0 | 2.6 | 7.9 | 0.0 | 0.3 | NW | 8.0 | 25 | 8 | 1012.6 | 92.9 | 4.4 | 0 | 0 | 0 | 0 | 0 | 0 | 28 |
| 29 | 5.6 | 0.5 | -1.8 | 7.0 | 5.4 | 0.0 | W | 5.7 | 20 | 6 | 1011.7 | 90.7 | 1.9 | 0 | 0 | 0 | 0 | 0 | 0 | 29 |
| 30 | 3.8 | -1.5 | -6.0 | 5.9 | 5.4 | 0.0 | W | 3.7 | 12 | 0 | 1011.0 | 92.2 | 0.2 | 0 | 0 | 0 | 0 | 0 | 0 | 30 |
| Total/Mean | 9.9 | 4.9 | 2.7 | 8.0 | 89.5 | 71.4 | X | 6.7 | X | 5.1 | 1008.3 | 90.9 | 6.9 | 1 | 1 | 0 | 0 | 0 | 0 | Total/Mean |
| *Diff./% | 0.0 | -0.1 | 124% | 125% | *Diff./% | |||||||||||||||
| Date | Max. Temp. (°C) 09/09h | Min. Temp. (°C) 09/09h | Grass Min. Temp. (°C) 21/09h | Earth (30cms) Temp. (°C) 09h | Sun (Hours) 00/00h | R'fall (MM) 09/09h | Wind Dir'n 09h | Mean Wind Speed (MPH) 00/00h | Max. Gust Speed (MPH) 00/00h | Cloud Cover (Oktas) 09h | Mean MSL Air Pressure (mB) 00/00h | Mean Rel. Humd. (%) 00/00h | Mean Temp. (°C) 00/00h | Fog (vis. <1000m @ 09h) | Fog (vis. <200m @ 09h) | Snow or Rain and Snow 00/00h | Snow Lying @ 09h (>50% cover) | Hail 00/00h | Thunder 00/00h | Date |
Differences from average:
Differences from average shown in red. Reference periods used are as follows: Temperature 30 Years 1981/2010; rainfall 30 Years 1981/2010; sunshine 30 Years 1981/2010.
(*The differences from average quoted during the course of the month relate to the cumulative daily averages up to the date of the last observation, not the averages for the month as a whole)
Additional Data:
Rainfall Duration N/A
Air Frost Duration 16.0 hours
Graphs and Charts:
Click on the following links to view this month's graphs and charts.....
1. Daily Maximum, Minimum & Grass Minimum Temperatures
2. Daily Maximum & Minimum Temperatures (with 30 Year Comparative Means)
3. Daily Earth (30 cms Depth) Temperature @ 0900 GMT 4. Daily Rainfall 5. Daily Sunshine
6. Daily Maximum Gust & Mean Wind Speed 7. Daily Wind Direction @ 0900 GMT
8. Daily Mean MSL Air Pressure 9. Daily Mean Relative Humidity 10. Thermograph
11. Barograph 12. Hygrograph 13. Anemograph 14. Wind Direction
15. Rainfall Intensity & Duration
November 2012 Weather Review:
......and click on the link below for a text report of the November 2012 weather in Royston
November (since 1972) at Royston (Iceni) Weather Station:
Mean day maximum temperature (30 years 1981/2010) 9.9°C
Mean night minimum temperature (30 years 1981/2010) 5.0°C
Highest temperature 17.8°C (2nd November 1984); lowest temperature -7.1C (28th November 2010)
Lowest grass minimum temperature -10.5°C (30th November 1978, 28th November 2010)
Warmest November 1994 (Mean temperature 10.5°C); coldest November 1985 (Mean temperature 4.2°C)
Average November rainfall (30 years 1981/2010) 57.1 mm
Wettest November 2000 (Rainfall 118.2 mm); driest November 1978 (Rainfall 17.2 mm)
Wettest Day 18th November 2004 (Rainfall 28.3 mm)
Highest number of "rain days" (0.2 mm or more) 24 (2009); lowest number of "rain days" 7 (1978)
Highest number of days with thunder 2 (1974)
Highest number of air frosts 10 (1985, 1996)
Highest number of ground frosts 17 (1985, 1988)
Highest number of days with snow falling 4 (1980, 1985, 2010)
Highest number of days with snow lying (ground with more than 50% snow cover @ 0900 GMT) 5 (1988)
|
|
|
|
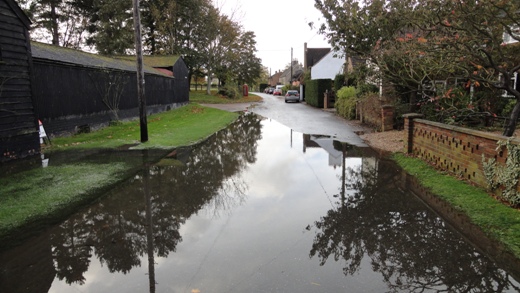
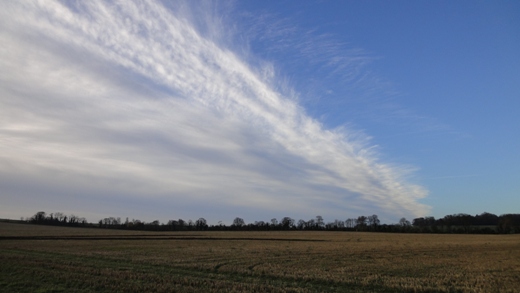
| The month of October 2012 in Royston experienced above average rainfall ending with 13.0 millimetres rainfall on 31st. It appears that heavy rainfall also occurred elsewhere in the Great Ouse catchment area as this was the scene in the village of Staploe, Bedfordshire (29 km NW of Royston) on 1st November 2012 at 1452 GMT. The floodwater here on the main street of the village is not deep and fairly easily passable but another stretch of floodwater was present on this road in the direction of Duloe making for difficult driving conditions in the area. Whilst the nearby Duloe Brook was in spate at this time it was not overflowing its banks so does not appear to have been directly responsible for the flood. Fortunately November ushered in drier conditions until near the end of the month when more heavy rain caused much flooding in the Great Ouse catchment and more widely across the region. It was noted on 25th November that the expansive Great Ouse flood plain downstream at Godmanchester was almost completely submerged by floodwater flowing out of the river, whilst the river Nene to the north was also experiencing exceptionally high water levels. | This is a typical example of how a zoom lens on a camera, whilst competently picking out a distant subject, can seem to 'compress' the landscape in between. In this picture (taken on 2nd November 2012 at 1320 GMT) of the House at Wrest Park, Silsoe, Bedfordshire (27 km SSW of Royston) the camera is on 16X zoom at a distance of at least 800 metres from the house half way down the Long Water. The photograph covers the end of the Long Water followed by a grassy bank, the croquet lawn, the statues area, a large area of lawns through which runs an avenue flanked by ornamental trees, and then the large French Parterre before reaching the steps up to the house! In the foreground of the picture can be seen a disturbance of the turf on the bank of the Long Water. This turf has been dug up by badgers and extensive damage caused by these animals was noted on both sides of the water. Much of Wrest Park is undergoing extensive restoration to return it to its former glory, with impressive results; new this year is the opening of the Dairy Sculpture Gallery (just out of view to the right of the House in this picture). | The picture above (taken on 23rd November 2012 at 0856 GMT) depicts the trailing edge of a cold front which had just passed over Royston, having been responsible for rainfall of 8.0 millimetres. This front had been moving slowly south-eastwards leaving very clear air and a deep blue sky in its wake, but shortly after being photographed the front stalled and moved back towards Royston before continuing south-eastwards again. However, this was not the end of the story so to speak as many miles to the south-west over the Atlantic Ocean to the west of the Iberian peninsula a low had already begun to form on the south-western extremity of the front which then began to move back north-westwards as a warm front. The low itself then headed straight for the British Isles and was centred south of Lands End at 1800 GMT on 24th November, and then continued on a north-eastward track to be situated in the North Sea between northern England and Denmark at 1200 GMT on 25th. Rainfall at Royston from this low was a relatively modest 13.1 millimetres, compared with some other places across the south where widespread flooding occurred. |
Return to Welcome to Royston (Iceni) Weather Station page
(This page last updated 8th December 2012 2138 GMT)