Royston (Iceni) Weather Station
Daily Weather Observations - June 2012
(All Times GMT)
| Date | Max. Temp. (°C) 09/09h | Min. Temp. (°C) 09/09h | Grass Min. Temp. (°C) 21/09h | Earth (30cms) Temp. (°C) 09h | Sun (Hours) 00/00h | R'fall (MM) 09/09h | Wind Dir'n 09h | Mean Wind Speed (MPH) 00/00h | Max. Gust Speed (MPH) 00/00h | Cloud Cover (Oktas) 09h | Mean MSL Air Pressure (mB) 00/00h | Mean Rel. Humd. (%) 00/00h | Mean Temp. (°C) 00/00h | Fog (vis. <1000m @ 09h) | Fog (vis. <200m @ 09h) | Snow or Rain and Snow 00/00h | Snow Lying @ 09h (>50% cover) | Hail 00/00h | Thunder 00/00h | Date |
| 1 | 20.5 | 13.6 | 13.4 | 17.4 | 1.3 | 2.3 | NW | 3.8 | 15 | 7 | 1018.6 | 86.7 | 15.3 | 0 | 0 | 0 | 0 | 0 | 0 | 1 |
| 2 | 15.1 | 10.0 | 10.0 | 16.9 | 0.3 | 8.7 | SE | 3.5 | 17 | 8 | 1014.7 | 82.3 | 11.9 | 0 | 0 | 0 | 0 | 0 | 0 | 2 |
| 3 | 10.7 | 9.1 | 9.1 | 15.8 | 0.0 | 18.3 | E | 4.1 | 14 | 8 | 1008.0 | 95.9 | 9.6 | 0 | 0 | 0 | 0 | 0 | 0 | 3 |
| 4 | 14.8 | 6.5 | 6.5 | 14.4 | 3.6 | 0.4 | N | 4.6 | 24 | 8 | 1014.7 | 86.9 | 9.3 | 0 | 0 | 0 | 0 | 0 | 0 | 4 |
| 5 | 15.2 | 6.1 | 3.4 | 14.4 | 0.1 | 2.5 | S | 6.2 | 24 | 8 | 1013.0 | 82.3 | 11.1 | 0 | 0 | 0 | 0 | 0 | 0 | 5 |
| 6 | 19.5 | 10.9 | 10.8 | 14.5 | 6.3 | 2.9 | SW | 8.0 | 28 | 3 | 1001.1 | 85.2 | 14.7 | 0 | 0 | 0 | 0 | 0 | 0 | 6 |
| 7 | 17.4 | 11.8 | 10.8 | 15.4 | 0.5 | 9.4 | S | 7.9 | 33 | 8 | 996.8 | 87.4 | 14.0 | 0 | 0 | 0 | 0 | 0 | 0 | 7 |
| 8 | 14.4 | 11.6 | 10.9 | 15.0 | 0.9 | 3.4 | S | 16.3 | 39 | 8 | 996.1 | 83.9 | 12.5 | 0 | 0 | 0 | 0 | 0 | 0 | 8 |
| 9 | 16.8 | 10.0 | 8.6 | 14.4 | 2.0 | TR | SW | 10.4 | 31 | 6 | 1008.1 | 73.3 | 13.1 | 0 | 0 | 0 | 0 | 0 | 0 | 9 |
| 10 | 18.5 | 7.5 | 4.8 | 14.9 | 7.0 | 24.3 | NE | 2.0 | 11 | 2 | 1007.8 | 75.0 | 13.5 | 0 | 0 | 0 | 0 | 0 | 0 | 10 |
| 11 | 11.4 | 10.4 | 10.2 | 15.4 | 0.0 | 11.6 | NE | 5.9 | 20 | 8 | 1003.1 | 98.5 | 10.7 | 0 | 0 | 0 | 0 | 0 | 0 | 11 |
| 12 | 13.5 | 9.4 | 9.0 | 14.1 | 0.1 | 0.0 | N | 4.5 | 21 | 8 | 1009.4 | 87.0 | 11.0 | 0 | 0 | 0 | 0 | 0 | 0 | 12 |
| 13 | 17.7 | 5.4 | 2.7 | 13.8 | 9.3 | 0.0 | W | 1.8 | 14 | 6 | 1016.3 | 77.1 | 11.6 | 0 | 0 | 0 | 0 | 0 | 0 | 13 |
| 14 | 17.8 | 7.5 | 4.9 | 14.5 | 10.2 | 5.1 | SE | 4.5 | 22 | 1 | 1016.0 | 74.4 | 12.9 | 0 | 0 | 0 | 0 | 0 | 0 | 14 |
| 15 | 18.9 | 10.9 | 10.1 | 15.4 | 8.5 | 5.1 | SW | 9.7 | 35 | 6 | 1006.8 | 79.9 | 14.5 | 0 | 0 | 0 | 0 | 0 | 0 | 15 |
| 16 | 18.9 | 10.7 | 8.5 | 15.5 | 7.9 | 0.0 | SW | 13.1 | 38 | 2 | 1006.8 | 75.7 | 14.5 | 0 | 0 | 0 | 0 | 0 | 0 | 16 |
| 17 | 20.3 | 11.3 | 9.5 | 15.8 | 7.8 | 2.2 | SW | 8.1 | 29 | 1 | 1015.2 | 72.5 | 15.4 | 0 | 0 | 0 | 0 | 0 | 0 | 17 |
| 18 | 20.5 | 11.5 | 11.2 | 16.5 | 3.5 | 0.0 | W | 3.4 | 16 | 7 | 1016.3 | 81.5 | 14.2 | 0 | 0 | 0 | 0 | 0 | 0 | 18 |
| 19 | 21.3 | 9.0 | 7.2 | 16.5 | 12.2 | 0.0 | SW | 4.1 | 17 | 1 | 1018.4 | 70.5 | 15.6 | 0 | 0 | 0 | 0 | 0 | 0 | 19 |
| 20 | 22.5 | 11.0 | 7.9 | 17.3 | 10.4 | 8.2 | E | 2.0 | 14 | 1 | 1016.2 | 72.3 | 16.1 | 0 | 0 | 0 | 0 | 0 | 0 | 20 |
| 21 | 19.9 | 10.8 | 9.0 | 17.1 | 1.1 | 2.0 | SE | 6.2 | 28 | 8 | 1005.0 | 88.6 | 15.0 | 0 | 0 | 0 | 0 | 0 | 0 | 21 |
| 22 | 17.7 | 10.4 | 9.4 | 16.7 | 3.3 | 0.3 | SW | 13.6 | 36 | 8 | 1008.7 | 82.3 | 13.6 | 0 | 0 | 0 | 0 | 0 | 0 | 22 |
| 23 | 18.6 | 10.0 | 8.7 | 15.9 | 6.0 | 12.9 | SW | 9.6 | 33 | 6 | 1017.7 | 77.7 | 13.8 | 0 | 0 | 0 | 0 | 0 | 0 | 23 |
| 24 | 19.8 | 10.8 | 10.3 | 16.0 | 4.0 | 3.2 | SW | 9.8 | 31 | 7 | 1010.6 | 85.1 | 14.5 | 0 | 0 | 0 | 0 | 0 | 0 | 24 |
| 25 | 20.6 | 11.0 | 9.1 | 16.4 | 10.7 | 0.0 | NW | 5.0 | 18 | 4 | 1017.1 | 76.4 | 15.8 | 0 | 0 | 0 | 0 | 0 | 0 | 25 |
| 26 | 22.4 | 12.8 | 11.1 | 17.0 | 5.5 | 0.1 | S | 5.3 | 19 | 4 | 1018.9 | 77.5 | 18.0 | 0 | 0 | 0 | 0 | 0 | 0 | 26 |
| 27 | 24.2 | 17.1 | 16.1 | 18.0 | 3.8 | 0.1 | SW | 6.7 | 21 | 7 | 1015.9 | 84.1 | 19.9 | 0 | 0 | 0 | 0 | 0 | 0 | 27 |
| 28 | 28.3 | 16.5 | 14.8 | 18.5 | 10.4 | 0.0 | SE | 6.7 | 25 | 8 | 1004.0 | 78.0 | 21.1 | 0 | 0 | 0 | 0 | 0 | 0 | 28 |
| 29 | 21.3 | 12.6 | 11.1 | 18.9 | 7.6 | 0.1 | S | 11.7 | 33 | 8 | 1003.3 | 77.2 | 16.6 | 0 | 0 | 0 | 0 | 0 | 0 | 29 |
| 30 | 21.1 | 14.7 | 12.9 | 18.5 | 8.3 | 2.0 | SW | 9.5 | 30 | 6 | 1006.8 | 74.1 | 16.8 | 0 | 0 | 0 | 0 | 0 | 0 | 30 |
| Total/Mean | 18.7 | 10.7 | 9.4 | 16.0 | 152.6 | 125.1 | X | 6.9 | X | 5.8 | 1010.4 | 81.0 | 14.2 | 0 | 0 | 0 | 0 | 0 | 0 | Total/Mean |
| *Diff./% | -1.5 | -0.1 | 83% | 262% | *Diff./% | |||||||||||||||
| Date | Max. Temp. (°C) 09/09h | Min. Temp. (°C) 09/09h | Grass Min. Temp. (°C) 21/09h | Earth (30cms) Temp. (°C) 09h | Sun (Hours) 00/00h | R'fall (MM) 09/09h | Wind Dir'n 09h | Mean Wind Speed (MPH) 00/00h | Max. Gust Speed (MPH) 00/00h | Cloud Cover (Oktas) 09h | Mean MSL Air Pressure (mB) 00/00h | Mean Rel. Humd. (%) 00/00h | Mean Temp. (°C) 00/00h | Fog (vis. <1000m @ 09h) | Fog (vis. <200m @ 09h) | Snow or Rain and Snow 00/00h | Snow Lying @ 09h (>50% cover) | Hail 00/00h | Thunder 00/00h | Date |
Differences from average:
Differences from average shown in red. Reference periods used are as follows: Temperature 30 Years 1981/2010; rainfall 30 Years 1981/2010; sunshine 30 Years 1981/2010.
(*The differences from average quoted during the course of the month relate to the cumulative daily averages up to the date of the last observation, not the averages for the month as a whole)
Additional Data:
Rainfall Duration N/A
Air Frost Duration 0.0 hours
Graphs and Charts:
Click on the following links to view this month's graphs and charts.....
1. Daily Maximum, Minimum & Grass Minimum Temperatures
2. Daily Maximum & Minimum Temperatures (with 30 Year Comparative Means)
3. Daily Earth (30 cms Depth) Temperature @ 0900 GMT 4. Daily Rainfall 5. Daily Sunshine
6. Daily Maximum Gust & Mean Wind Speed 7. Daily Wind Direction @ 0900 GMT
8. Daily Mean MSL Air Pressure 9. Daily Mean Relative Humidity 10. Thermograph
11. Barograph 12. Hygrograph 13. Anemograph 14. Wind Direction
15. Rainfall Intensity & Duration
June 2012 Weather Review:
......and click on the link below for a text report of the June 2012 weather in Royston
June (since 1972) at Royston (Iceni) Weather Station:
Mean daily maximum temperature (30 years 1981/2010) 20.2°C
Mean daily minimum temperature (30 years 1981/2010) 10.8°C
Highest temperature 33.7°C (26th June 1976); lowest temperature 2.2°C (3rd June 1975)
Lowest grass minimum temperature -1.0°C (2nd June 1991)
Warmest June 1976 (Mean temperature 18.3°C); coldest June 1977 (Mean temperature 12.5°C)
Average June rainfall (30 years 1981/2010) 47.8 mm
Wettest June 1985 (Rainfall 135.4 mm); driest June 1996 (Rainfall 8.0 mm)
Wettest Day 19th June 1973 (Rainfall 36.8 mm);
Highest number of "rain days" (0.2 mm or more) 23 (1997); lowest number of "rain days" 3 (1976, 1996)
Highest number of days with thunder 10 (1982)
Highest number of air frosts 0
Highest number of ground frosts 2 (1989)
Highest number of days with snow falling 1 (1975)
Highest number of days with snow lying (ground with more than 50% snow cover @ 0900 GMT) 0
|
|
|
|
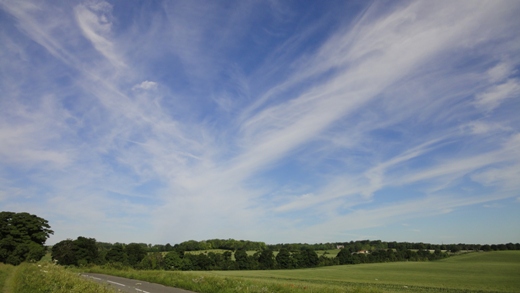
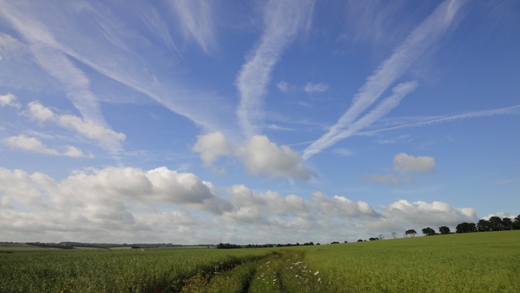
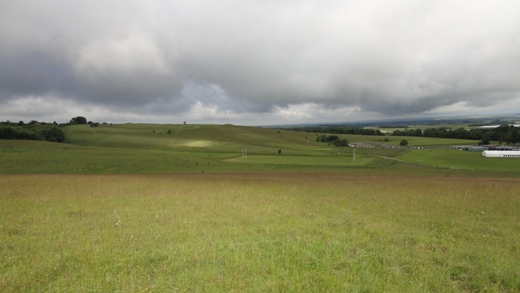
| This fine display of cirrus cloud as seen over Royston on 10th June 2012 at 0741 GMT heralded the arrival of heavy rainfall in the early hours of 11th giving a total of 24.3 millimetres by 0900 GMT. The whole country was dominated by low pressure with twin low pressure centres in the English Channel and to the west of Ireland. Rainfall from these systems moved slowly northwards, the heavier bursts reaching Royston from the south after midnight. Rainfall was particularly heavy along the south coast in the evening of 10th. In this picture the B1039 Royston to Saffron Walden road can just be discerned in the foreground, whilst the town of Royston is some 2 km to the NW beyond the tree belt in the distance. A light WSW air of mean speed 2 knots gusting to 4 knots in a temperature of 13.5°C made for pleasant conditions in the early morning sunshine. Despite the advancing rainfall Royston managed to experience 7.0 hours sunshine on 10th. | Aircraft contrails dominate the sky on 17th June 2012 (at 0716 GMT) in this photograph taken 2 km E of Royston looking to the SSW. Such contrails can often be identified on high resolution satellite images with pictures such as this providing the 'ground truth'. As can be seen cumulus cloud is beginning to develop and the and the 0957 GMT satellite image shows this cloud arranged in lines or 'streets' right across southern England and East Anglia. Low pressure dominated in the vicinity of the British Isles at this time with a ridge of high pressure straddled across the near continent to the SE. It was rather windy in this open location, a SW wind of mean speed 13 knots gusting to 24 knots swaying the almost 2 metres high oil seed rape crop on both sides of the grassed over track visible in the lower middle of the picture. Just 2 to 3 weeks earlier this whole scene was a sea of yellow, the flowers having now given way to oil seed pods. | The clouds hang low over Therfield Heath, Royston in this view from its eastern end close to the town itself on 18th June 2012 (at 0747 GMT). The south Cambridgeshire Plain lies to the right of the picture, whilst beyond the horizon on the right lies the county of Bedfordshire. Conditions were very damp at this time, the light rain only recently petering out. The temperature is 12.6°C with a light NW wind of mean speed 3 knots gusting to 6 knots coming off the Plain and on to the heath. This picture virtually disguises the dry valley running across the view from S (left) to N (right). A number of these dry valleys dissect the heath, having been formed by streams in wetter times long ago, but today the water table is well below the surface and no water flows in the valleys (or indeed anywhere in the town of Royston where there is no surface drainage due to the porous nature of the underlying chalk). A maximum temperature of 20.5°C was achieved later that day, with a sunshine total of 3.5 hours. |
Return to Welcome to Royston (Iceni) Weather Station page
(This page last updated 8th July 2012 2020 GMT)