Royston (Iceni) Weather Station
Daily Weather Observations - OCTOBER 2010
(All Times GMT)
| Date | Max. Temp. (°C) 09/09h | Min. Temp. (°C) 09/09h | Grass Min. Temp. (°C) 21/09h | Earth (30cms) Temp. (°C) 09h | Sun (Hours) 00/00h | R'fall (MM) 09/09h | Wind Dir'n 09h | Mean Wind Speed (MPH) 00/00h | Max. Gust Speed (MPH) 00/00h | Cloud Cover (Oktas) 09h | Mean MSL Air Pressure (mB) 00/00h | Mean Rel. Humd. (%) 00/00h | Mean Temp. (°C) 00/00h | Fog (vis. <1000m @ 09h) | Fog (vis. <200m @ 09h) | Snow or Rain and Snow 00/00h | Snow Lying @ 09h (>50% cover) | Hail 00/00h | Thunder 00/00h | Date |
| 1 | 15.0 | 11.0 | 9.7 | 14.2 | 0.0 | 9.3 | S | 8.1 | 31 | 8 | 1002.1 | 90.7 | 13.3 | 0 | 0 | 0 | 0 | 0 | 0 | 1 |
| 2 | 16.0 | 8.9 | 8.1 | 14.2 | 5.4 | 13.4 | S | 4.4 | 20 | 4 | 1002.7 | 88.4 | 12.5 | 0 | 0 | 0 | 0 | 0 | 0 | 2 |
| 3 | 17.6 | 11.4 | 10.6 | 14.1 | 1.4 | 2.5 | SE | 7.4 | 34 | 8 | 995.2 | 87.3 | 14.5 | 0 | 0 | 0 | 0 | 0 | 0 | 3 |
| 4 | 15.7 | 11.7 | 9.1 | 14.2 | 0.1 | 0.2 | S | 2.2 | 18 | 8 | 998.2 | 91.7 | 13.2 | 1 | 0 | 0 | 0 | 0 | 0 | 4 |
| 5 | 17.8 | 11.1 | 9.4 | 14.0 | 0.2 | 7.0 | S | 7.0 | 23 | 8 | 999.5 | 84.7 | 14.7 | 0 | 0 | 0 | 0 | 0 | 0 | 5 |
| 6 | 17.3 | 13.4 | 12.1 | 14.4 | 6.3 | 0.1 | SW | 6.7 | 24 | 8 | 1005.7 | 80.2 | 13.8 | 0 | 0 | 0 | 0 | 0 | 0 | 6 |
| 7 | 17.2 | 9.3 | 7.4 | 13.8 | 8.5 | TR | SE | 3.8 | 16 | 2 | 1017.3 | 81.6 | 13.0 | 0 | 0 | 0 | 0 | 0 | 0 | 7 |
| 8 | 19.1 | 13.5 | 13.0 | 14.0 | 2.2 | 0.0 | E | 2.5 | 16 | 8 | 1015.9 | 88.9 | 15.9 | 1 | 0 | 0 | 0 | 0 | 0 | 8 |
| 9 | 16.3 | 14.0 | 13.6 | 14.6 | 0.0 | 0.0 | NE | 4.3 | 18 | 8 | 1015.0 | 87.3 | 14.7 | 0 | 0 | 0 | 0 | 0 | 0 | 9 |
| 10 | 20.7 | 12.0 | 12.0 | 14.6 | 7.9 | 0.0 | NE | 4.0 | 18 | 8 | 1013.4 | 81.3 | 14.1 | 1 | 0 | 0 | 0 | 0 | 0 | 10 |
| 11 | 18.5 | 8.8 | 4.0 | 14.3 | 6.7 | 0.0 | NE | 5.4 | 20 | 8 | 1018.9 | 85.0 | 12.0 | 0 | 0 | 0 | 0 | 0 | 0 | 11 |
| 12 | 16.0 | 6.7 | 3.0 | 13.6 | 3.9 | 0.0 | NE | 3.7 | 14 | 8 | 1020.7 | 82.5 | 10.7 | 0 | 0 | 0 | 0 | 0 | 0 | 12 |
| 13 | 11.5 | 9.0 | 8.5 | 13.4 | 0.0 | TR | N | 2.8 | 12 | 8 | 1020.8 | 80.3 | 10.0 | 0 | 0 | 0 | 0 | 0 | 0 | 13 |
| 14 | 10.5 | 8.3 | 8.0 | 13.1 | 0.0 | 1.0 | N | 1.7 | 10 | 8 | 1020.8 | 87.2 | 9.6 | 0 | 0 | 0 | 0 | 0 | 0 | 14 |
| 15 | 12.2 | 9.0 | 8.9 | 12.9 | 0.1 | 1.7 | NW | 4.0 | 18 | 8 | 1017.4 | 88.3 | 10.1 | 0 | 0 | 0 | 0 | 0 | 0 | 15 |
| 16 | 13.0 | 5.6 | 3.1 | 12.5 | 5.6 | 2.7 | N | 3.8 | 22 | 5 | 1020.2 | 88.2 | 7.2 | 0 | 0 | 0 | 0 | 0 | 0 | 16 |
| 17 | 14.1 | 3.0 | -0.5 | 11.5 | 7.4 | 0.2 | W | 2.5 | 13 | 4 | 1025.2 | 77.0 | 6.8 | 0 | 0 | 0 | 0 | 0 | 0 | 17 |
| 18 | 14.2 | 5.8 | 2.6 | 11.0 | 1.7 | 1.8 | SW | 8.1 | 23 | 6 | 1017.6 | 77.8 | 10.0 | 0 | 0 | 0 | 0 | 0 | 0 | 18 |
| 19 | 12.2 | 6.1 | 4.4 | 11.4 | 3.0 | 2.3 | W | 7.8 | 25 | 0 | 1009.6 | 87.7 | 8.1 | 0 | 0 | 0 | 0 | 0 | 0 | 19 |
| 20 | 9.3 | 1.0 | -1.0 | 10.7 | 8.8 | 0.0 | NW | 6.8 | 21 | 0 | 1018.7 | 75.1 | 4.0 | 0 | 0 | 0 | 0 | 0 | 0 | 20 |
| 21 | 12.5 | 2.5 | -0.1 | 9.2 | 7.2 | 0.0 | SW | 8.5 | 23 | 1 | 1021.2 | 74.8 | 6.9 | 0 | 0 | 0 | 0 | 0 | 0 | 21 |
| 22 | 13.8 | 5.4 | 3.5 | 9.0 | 3.6 | 7.9 | SW | 8.0 | 24 | 8 | 1015.5 | 78.7 | 8.9 | 0 | 0 | 0 | 0 | 0 | 0 | 22 |
| 23 | 12.0 | 8.6 | 7.0 | 9.7 | 2.5 | 2.1 | W | 7.8 | 24 | 4 | 1002.4 | 88.9 | 8.5 | 0 | 0 | 0 | 0 | 0 | 0 | 23 |
| 24 | 10.5 | 1.5 | -1.0 | 9.4 | 6.1 | 0.0 | NW | 4.5 | 17 | 0 | 1015.4 | 85.8 | 4.6 | 0 | 0 | 0 | 0 | 0 | 0 | 24 |
| 25 | 8.9 | -0.1 | -3.4 | 8.4 | 9.1 | 0.1 | NW | 3.6 | 15 | 0 | 1027.6 | 80.5 | 3.9 | 0 | 0 | 0 | 0 | 0 | 0 | 25 |
| 26 | 13.3 | 3.5 | 0.4 | 7.6 | 0.0 | 6.9 | S | 10.8 | 33 | 8 | 1021.1 | 86.5 | 8.4 | 0 | 0 | 0 | 0 | 0 | 0 | 26 |
| 27 | 16.5 | 12.1 | 10.4 | 8.9 | 6.6 | 0.1 | SW | 10.1 | 29 | 7 | 1014.7 | 82.0 | 12.8 | 0 | 0 | 0 | 0 | 0 | 0 | 27 |
| 28 | 15.5 | 9.7 | 7.7 | 9.5 | 1.5 | 0.0 | SW | 9.5 | 27 | 8 | 1013.0 | 85.0 | 12.1 | 0 | 0 | 0 | 0 | 0 | 0 | 28 |
| 29 | 13.5 | 11.0 | 9.4 | 10.0 | 0.1 | 0.3 | S | 10.0 | 33 | 8 | 998.5 | 83.7 | 12.0 | 0 | 0 | 0 | 0 | 0 | 0 | 29 |
| 30 | 14.5 | 8.1 | 6.4 | 10.2 | 6.7 | TR | SW | 6.6 | 22 | 1 | 996.6 | 84.1 | 10.4 | 0 | 0 | 0 | 0 | 0 | 0 | 30 |
| 31 | 12.6 | 8.5 | 6.4 | 10.0 | 0.0 | 4.3 | NE | 2.0 | 14 | 8 | 1000.9 | 90.8 | 10.2 | 0 | 0 | 0 | 0 | 0 | 0 | 31 |
| Total/Mean | 14.4 | 8.1 | 6.2 | 11.9 | 112.4 | 63.9 | X | 5.8 | X | 5.7 | 1012.3 | 84.3 | 10.5 | 3 | 0 | 0 | 0 | 0 | 0 | Total/Mean |
| *Diff./% | -0.2 | +0.1 | 98% | 112% | *Diff./% | |||||||||||||||
| Date | Max. Temp. (°C) 09/09h | Min. Temp. (°C) 09/09h | Grass Min. Temp. (°C) 21/09h | Earth (30cms) Temp. (°C) 09h | Sun (Hours) 00/00h | R'fall (MM) 09/09h | Wind Dir'n 09h | Mean Wind Speed (MPH) 00/00h | Max. Gust Speed (MPH) 00/00h | Cloud Cover (Oktas) 09h | Mean MSL Air Pressure (mB) 00/00h | Mean Rel. Humd. (%) 00/00h | Mean Temp. (°C) 00/00h | Fog (vis. <1000m @ 09h) | Fog (vis. <200m @ 09h) | Snow or Rain and Snow 00/00h | Snow Lying @ 09h (>50% cover) | Hail 00/00h | Thunder 00/00h | Date |
Differences from average:
Differences from average shown in red. Reference periods used are as follows: Temperature 30 Years 1976/2005; rainfall 30 Years 1971/2000; sunshine 30 Years 1971/2000.
(*The differences from average quoted during the course of the month relate to the cumulative daily averages up to the date of the last observation, not the averages for the month as a whole)
Additional Data:
Rainfall Duration N/A
Air Frost Duration 1.8 hours
Graphs and Charts:
Click on the following links to view this month's graphs and charts.....
1. Daily Maximum, Minimum & Grass Minimum Temperatures
2. Daily Maximum & Minimum Temperatures (with 30 Year Comparative Means)
3. Daily Earth (30 cms Depth) Temperature @ 0900 GMT 4. Daily Rainfall 5. Daily Sunshine
6. Daily Maximum Gust & Mean Wind Speed 7. Daily Wind Direction @ 0900 GMT
8. Daily Mean MSL Air Pressure 9. Daily Mean Relative Humidity 10. Thermograph
11. Barograph 12. Hygrograph 13. Anemograph 14. Wind Direction
15. Rainfall Intensity & Duration
October 2010 Weather Review:
......and click on the link below for a text report of the October 2010 weather in Royston
October (since 1972) at Royston (Iceni) Weather Station:
Mean day maximum temperature (30 years 1976/2005) 14.6°C
Mean night minimum temperature (30 years 1976/2005) 8.0°C
Highest temperature 27.5°C (1st October 1985); lowest temperature -3.6°C (29th October 1997)
Lowest grass minimum temperature -8.3°C (29th October 1997)
Warmest October 2001 (Mean temperature 14.3°C); coldest October 1974 (Mean temperature 7.3°C)
Highest no. of days with air frost 5 (1997); highest no. of days with ground frost 13 (2003)
Average October rainfall (30 years 1971/2000) 57.0 mm
Wettest October 2001 (Rainfall 137.8 mm); driest October 1972 (Rainfall 4.1 mm)
Wettest Day 20th October 2001 (Rainfall 51.8 mm);
Highest number of "rain days" (0.2 mm or more) 23 (2000); lowest number of "rain days" 3 (1972)
Highest number of days with thunder 3 (1984)
|
|
|
|
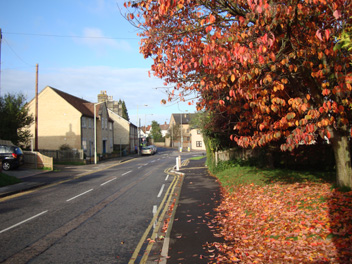
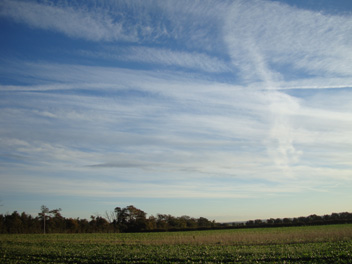
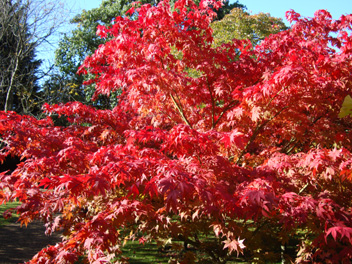
| This is the north-western end of the Barkway Road as it joins the A10 one-way system (southbound) in downtown Royston. On Priory Lane off to the right is the old Police Station and the Priory Memorial Gardens whilst straight ahead is the market area and the southern ends of the High Street and King Street. The picture was taken on 16th October 2010 (at 0844 GMT) with a dash of Autumn colour and early leaf fall in evidence. The temperature at this time was 7.9°C, later rising to a maximum of 13.0°C (1.1°C below the 30 Year (1976/2005) average for this day). The wind direction is NNW, and the mean wind speed is 5 knots, gusting to 14 knots. Sunshine for the day was 5.6 hours. | On 21st October 2010 when this photograph was taken high pressure covered the southern half of the British Isles, gradually migrating eastwards into Europe. The morning on this date saw a fine display of cirrus cloud (plus some aircraft contrails) over Royston and this view (at 0738 GMT) is looking north-eastwards from a point near to the A505 road 2.5 km E of the town. A fresh SW breeze of mean speed 9 knots gusting to 15 knots is sweeping across this very open area in a temperature of 3.9°C. The early morning sunshine (7.2 hours for the day) is illuminating the shiny leaves of this crop of sugar beet, which will soon be due for harvesting and transporting to a processing plant, the sugar campaign having already started. | The first air frost of the season at Royston (Iceni) Weather Station occurred on 25th October 2010, even though it was a somewhat marginal situation with the minimum temperature only being 0.1°C below zero. However, lower parts of Royston and areas to the north on the South Cambridgeshire Plain may have experienced a lower minimum temperature. This day had the benefit of unbroken sunshine and the sunshine total of 9.1 hours makes it a likely candidate for being the sunniest day in October this year. On this date the University Botanic Garden in Cambridge (21 km NE of Royston) was a blaze of colour in the bright sunshine, this tree (as photographed at 1032 GMT) near to the Hills Road entrance being just one such example. |
Return to Welcome to Royston (Iceni) Weather Station page
(This page last updated 11th November 2010 2059 GMT)