Royston (Iceni) Weather Station
Daily Weather Observations - August 2010
(All Times GMT)
| Date | Max. Temp. (°C) 09/09h | Min. Temp. (°C) 09/09h | Grass Min. Temp. (°C) 21/09h | Earth (30cms) Temp. (°C) 09h | Sun (Hours) 00/00h | R'fall (MM) 09/09h | Wind Dir'n 09h | Mean Wind Speed (MPH) 00/00h | Max. Gust Speed (MPH) 00/00h | Cloud Cover (Oktas) 09h | Mean MSL Air Pressure (mB) 00/00h | Mean Rel. Humd. (%) 00/00h | Mean Temp. (°C) 00/00h | Fog (vis. <1000m @ 09h) | Fog (vis. <200m @ 09h) | Snow or Rain and Snow 00/00h | Snow Lying @ 09h (>50% cover) | Hail 00/00h | Thunder 00/00h | Date |
| 1 | 21.2 | 13.6 | 12.2 | 19.0 | 0.1 | 0.4 | NW | 3.8 | 15 | 8 | 1012.3 | 72.0 | 17.3 | 0 | 0 | 0 | 0 | 0 | 0 | 1 |
| 2 | 20.8 | 12.9 | 11.0 | 18.7 | 2.5 | 2.8 | NW | 2.4 | 15 | 5 | 1016.2 | 80.2 | 16.0 | 0 | 0 | 0 | 0 | 0 | 0 | 2 |
| 3 | 22.9 | 11.5 | 9.5 | 18.2 | 5.4 | 0.6 | W | 5.7 | 22 | 5 | 1014.3 | 70.6 | 17.5 | 0 | 0 | 0 | 0 | 0 | 0 | 3 |
| 4 | 17.1 | 13.6 | 13.0 | 18.6 | 0.2 | 13.2 | SW | 4.6 | 15 | 8 | 1006.7 | 86.9 | 14.5 | 0 | 0 | 0 | 0 | 0 | 0 | 4 |
| 5 | 20.5 | 9.9 | 8.1 | 17.5 | 3.2 | 0.0 | W | 6.1 | 20 | 6 | 1011.3 | 70.1 | 14.9 | 0 | 0 | 0 | 0 | 0 | 0 | 5 |
| 6 | 21.8 | 11.1 | 8.5 | 17.4 | 4.1 | 3.7 | S | 8.1 | 26 | 2 | 1013.4 | 74.1 | 16.7 | 0 | 0 | 0 | 0 | 0 | 0 | 6 |
| 7 | 22.2 | 15.7 | 15.2 | 18.0 | 1.7 | 0.0 | SW | 5.1 | 19 | 8 | 1013.7 | 79.6 | 17.7 | 0 | 0 | 0 | 0 | 0 | 0 | 7 |
| 8 | 23.0 | 13.0 | 10.5 | 18.1 | 4.0 | 0.0 | NW | 3.1 | 14 | 6 | 1018.7 | 72.5 | 17.3 | 0 | 0 | 0 | 0 | 0 | 0 | 8 |
| 9 | 25.0 | 13.5 | 12.2 | 18.5 | 9.9 | 3.2 | SW | 7.5 | 25 | 3 | 1013.8 | 65.1 | 19.0 | 0 | 0 | 0 | 0 | 0 | 0 | 9 |
| 10 | 18.0 | 13.5 | 13.5 | 19.1 | 0.6 | 9.9 | SW | 5.7 | 23 | 8 | 1009.2 | 87.5 | 15.7 | 0 | 0 | 0 | 0 | 0 | 0 | 10 |
| 11 | 21.7 | 10.7 | 8.7 | 18.0 | 6.8 | 1.4 | W | 4.8 | 18 | 0 | 1012.2 | 72.0 | 15.9 | 0 | 0 | 0 | 0 | 0 | 0 | 11 |
| 12 | 20.5 | 12.8 | 11.0 | 18.1 | 2.2 | 3.9 | W | 5.7 | 20 | 8 | 1015.0 | 84.1 | 14.2 | 0 | 0 | 0 | 0 | 0 | 0 | 12 |
| 13 | 17.3 | 10.7 | 9.1 | 17.6 | 0.5 | 7.2 | W | 6.2 | 21 | 8 | 1015.9 | 88.5 | 13.8 | 0 | 0 | 0 | 0 | 0 | 0 | 13 |
| 14 | 18.4 | 12.5 | 12.5 | 17.4 | 3.0 | 3.4 | N | 2.7 | 14 | 8 | 1016.8 | 85.9 | 14.6 | 0 | 0 | 0 | 0 | 0 | 0 | 14 |
| 15 | 22.1 | 12.5 | 10.2 | 17.4 | 5.9 | 0.0 | NE | 5.7 | 25 | 7 | 1020.2 | 79.0 | 16.5 | 0 | 0 | 0 | 0 | 0 | 0 | 15 |
| 16 | 22.8 | 12.0 | 9.9 | 17.6 | 4.6 | 0.1 | NW | 6.2 | 25 | 8 | 1015.0 | 72.7 | 16.0 | 0 | 0 | 0 | 0 | 0 | 0 | 16 |
| 17 | 21.5 | 13.6 | 10.7 | 17.5 | 1.8 | 2.0 | SW | 6.1 | 22 | 8 | 1009.0 | 80.1 | 16.6 | 0 | 0 | 0 | 0 | 0 | 0 | 17 |
| 18 | 20.4 | 10.1 | 8.3 | 17.1 | 4.8 | TR | W | 6.1 | 22 | 8 | 1006.9 | 74.4 | 15.1 | 0 | 0 | 0 | 0 | 0 | 0 | 18 |
| 19 | 21.5 | 11.5 | 9.9 | 17.0 | 3.9 | 2.0 | SW | 6.9 | 30 | 2 | 1011.2 | 73.5 | 16.2 | 0 | 0 | 0 | 0 | 0 | 0 | 19 |
| 20 | 24.2 | 14.9 | 13.9 | 17.5 | 3.8 | TR | S | 11.1 | 29 | 8 | 1013.7 | 80.1 | 19.3 | 0 | 0 | 0 | 0 | 0 | 0 | 20 |
| 21 | 24.7 | 18.5 | 17.1 | 18.3 | 3.0 | 5.5 | SW | 11.1 | 31 | 8 | 1016.4 | 78.6 | 20.8 | 0 | 0 | 0 | 0 | 0 | 0 | 21 |
| 22 | 24.0 | 17.0 | 16.7 | 18.8 | 7.6 | 19.0 | SW | 4.7 | 21 | 2 | 1011.8 | 75.2 | 19.7 | 0 | 0 | 0 | 0 | 0 | 1 | 22 |
| 23 | 20.3 | 15.7 | 16.0 | 19.0 | 2.4 | 0.7 | W | 8.6 | 35 | 8 | 998.1 | 85.4 | 16.7 | 0 | 0 | 0 | 0 | 0 | 0 | 23 |
| 24 | 20.5 | 10.7 | 9.1 | 18.1 | 6.5 | 0.0 | W | 11.3 | 36 | 1 | 1007.2 | 69.0 | 15.1 | 0 | 0 | 0 | 0 | 0 | 0 | 24 |
| 25 | 17.3 | 11.5 | 9.7 | 17.6 | 2.3 | 51.8 | SW | 4.0 | 15 | 5 | 1012.2 | 84.3 | 13.9 | 0 | 0 | 0 | 0 | 0 | 0 | 25 |
| 26 | 18.8 | 12.4 | 11.1 | 16.9 | 0.0 | 16.7 | E | 3.7 | 18 | 8 | 1003.8 | 92.6 | 15.3 | 0 | 0 | 0 | 0 | 0 | 0 | 26 |
| 27 | 19.0 | 11.0 | 10.9 | 16.9 | 2.7 | 0.0 | N | 4.8 | 19 | 7 | 1010.5 | 82.2 | 13.6 | 0 | 0 | 0 | 0 | 0 | 0 | 27 |
| 28 | 19.6 | 9.7 | 7.7 | 16.6 | 6.5 | 0.9 | W | 8.1 | 26 | 2 | 1018.3 | 77.7 | 13.6 | 0 | 0 | 0 | 0 | 0 | 0 | 28 |
| 29 | 17.9 | 11.2 | 9.9 | 16.6 | 3.0 | 0.9 | W | 10.9 | 38 | 8 | 1015.1 | 71.6 | 13.6 | 0 | 0 | 0 | 0 | 0 | 0 | 29 |
| 30 | 18.6 | 7.7 | 5.5 | 16.0 | 6.0 | 0.0 | NW | 5.9 | 24 | 5 | 1023.1 | 76.0 | 12.5 | 0 | 0 | 0 | 0 | 0 | 0 | 30 |
| 31 | 20.2 | 7.2 | 3.9 | 15.8 | 11.8 | 0.0 | N | 1.8 | 12 | 1 | 1025.1 | 76.3 | 12.9 | 0 | 0 | 0 | 0 | 0 | 0 | 31 |
| Total/Mean | 20.8 | 12.3 | 10.8 | 17.7 | 120.6 | 149.3 | X | 6.1 | X | 5.8 | 1013.1 | 78.0 | 15.9 | 0 | 0 | 0 | 0 | 0 | 1 | Total/Mean |
| *Diff./% | -1.6 | -0.4 | 65% | 301% | *Diff./% | |||||||||||||||
| Date | Max. Temp. (°C) 09/09h | Min. Temp. (°C) 09/09h | Grass Min. Temp. (°C) 21/09h | Earth (30cms) Temp. (°C) 09h | Sun (Hours) 00/00h | R'fall (MM) 09/09h | Wind Dir'n 09h | Mean Wind Speed (MPH) 00/00h | Max. Gust Speed (MPH) 00/00h | Cloud Cover (Oktas) 09h | Mean MSL Air Pressure (mB) 00/00h | Mean Rel. Humd. (%) 00/00h | Mean Temp. (°C) 00/00h | Fog (vis. <1000m @ 09h) | Fog (vis. <200m @ 09h) | Snow or Rain and Snow 00/00h | Snow Lying @ 09h (>50% cover) | Hail 00/00h | Thunder 00/00h | Date |
Differences from average:
Differences from average shown in red. Reference periods used are as follows: Temperature 30 Years 1976/2005; rainfall 30 Years 1971/2000; sunshine 30 Years 1971/2000.
(*The differences from average quoted during the course of the month relate to the cumulative daily averages up to the date of the last observation, not the averages for the month as a whole)
Additional Data:
Rainfall Duration N/A
Air Frost Duration NIL hours
Graphs and Charts:
Click on the following links to view this month's graphs and charts.....
1. Daily Maximum, Minimum & Grass Minimum Temperatures
2. Daily Maximum & Minimum Temperatures (with 30 Year Comparative Means)
3. Daily Earth (30 cms Depth) Temperature @ 0900 GMT 4. Daily Rainfall 5. Daily Sunshine
6. Daily Maximum Gust & Mean Wind Speed 7. Daily Wind Direction @ 0900 GMT
8. Daily Mean MSL Air Pressure 9. Daily Mean Relative Humidity 10. Thermograph
11. Barograph 12. Hygrograph 13. Anemograph 14. Wind Direction
15. Rainfall Intensity & Duration
August 2010 Weather Review:
......and click on the link below for a text report of the August 2010 weather in Royston
August (since 1972) at Royston (Iceni) Weather Station:
Mean day maximum temperature (30 years 1976/2005) 22.4°C
Mean night minimum temperature (30 years 1976/2005) 12.7°C
Highest temperature 36.4°C (10th August 2003); lowest temperature 5.1°C (23rd August1993)
Lowest grass minimum temperature 1.0°C (23rd August1993)
Hottest August 1997 (Mean temperature 20.9°C); coolest August 1986 (Mean temperature 14.9°C)
Average August rainfall (30 years 1971/2000) 49.6 mm
Wettest August 1974 (Rainfall 109.0 mm); driest August 2003 (Rainfall 0.7 mm)
Wettest Day 6th August 2009 (Rainfall 52.4 mm)
Highest number of "rain days" (0.2 mm or more) 19 (2004, 2008); lowest number of "rain days" 1 (2003)
Highest number of days with thunder 6 (1999)
|
|
|
|
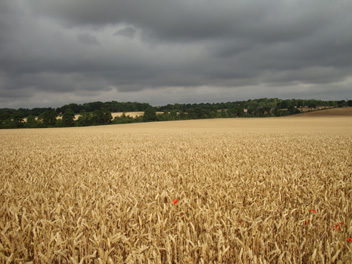
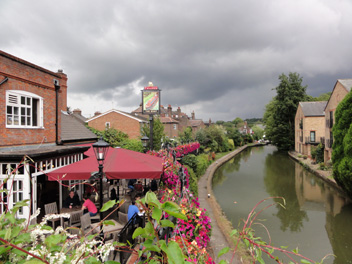
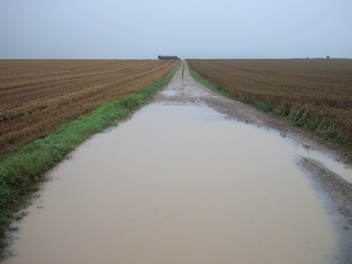
| In the light of reduced grain crop yields in some parts of the Northern Hemisphere this summer this field of healthy looking wheat is a welcome sight indeed. This crop between Royston and Barley was pictured on 2nd August 2010 (at 0802 GMT) and looks ready to be harvested. However, the inclement weather experienced during much of August meant that near the end of month it had still not been gathered in. The leaden sky seen here was a portent of the weather to come and only 2.5 hours sunshine was logged on this day, and the month itself was a very dull one. At the time of this photograph the temperature was 16.6°C, and a NNW wind of mean speed 4 knots gusting to 9 knots was rustling the wheat ears. The maximum temperature for the day was 20.8°C. | This is a south-eastwards view along the Grand Union Canal at Berkhamsted (48 km SW of Royston), as pictured on 14th August 2010 at 1606 GMT. The Boat P. H. is on the left where most of the 'outdoor' patrons are sitting under cover due to the showery nature of the afternoon as indicated by the dark clouds in the picture. A large sign on the bridge from which the photograph was taken proclaims 'Grand Junction Canal', another name for this section of the canal which runs from the River Thames at Brentford to Braunston in Northamptonshire. The full length of the Grand Union Canal runs further north-westwards to Birmingham. It was a relatively poor Summer's day at Royston with a maximum temperature of only 18.4°C (after an overnight minimum of 12.5°C), and sunshine of only 3.0 hours. | The flooding of this farm track at Lowerfield near Royston (as pictured on 26th August 2010 at 0755 GMT) is no surprise given that the previous day was the second wettest August day in Royston since at least 1972. Rainfall was 51.8 millimetres, only 6th August 2009 being wetter with 52.4 millimetres rainfall. On this day a further 16.7 millimetres rainfall was recorded, the maximum temperature reached only 18.8°C (2.4°C below the 30 Year (1976/2005) mean for this day), and no sunshine at all occurred. The wheat crop on the right of the picture has suffered from frequent bouts of rainfall (e.g. 19.0 millimetres on 22nd) whilst awaiting harvesting and is very wet indeed. The prospects for gathering in the crop at its best have been bleak in this month which is already (at 26th) the wettest August since 1912. |
Return to Welcome to Royston (Iceni) Weather Station page
(This page last updated 11th September 2010 1950 GMT)