Royston (Iceni) Weather Station
Daily Weather Observations - April 2010
(All Times GMT)
| Date | Max. Temp. (°C) 09/09h | Min. Temp. (°C) 09/09h | Grass Min. Temp. (°C) 21/09h | Earth (30cms) Temp. (°C) 09h | Sun (Hours) 00/00h | R'fall (MM) 09/09h | Wind Dir'n 09h | Mean Wind Speed (MPH) 00/00h | Max. Gust Speed (MPH) 00/00h | Cloud Cover (Oktas) 09h | Mean MSL Air Pressure (mB) 00/00h | Mean Rel. Humd. (%) 00/00h | Mean Temp. (°C) 00/00h | Fog (vis. <1000m @ 09h) | Fog (vis. <200m @ 09h) | Snow or Rain and Snow 00/00h | Snow Lying @ 09h (>50% cover) | Hail 00/00h | Thunder 00/00h | Date |
| 1 | 10.0 | 1.1 | -0.5 | 8.0 | 5.0 | 1.5 | W | 10.7 | 30 | 0 | 1005.9 | 75.0 | 4.7 | 0 | 0 | 0 | 0 | 0 | 0 | 1 |
| 2 | 10.0 | 4.1 | 2.4 | 7.9 | 1.3 | 3.1 | S | 7.8 | 32 | 7 | 1002.0 | 78.7 | 6.9 | 0 | 0 | 0 | 0 | 0 | 0 | 2 |
| 3 | 12.0 | 3.5 | 2.1 | 7.9 | 3.1 | 0.2 | S | 5.7 | 26 | 2 | 1000.1 | 75.6 | 7.1 | 0 | 0 | 0 | 0 | 0 | 0 | 3 |
| 4 | 11.8 | 2.8 | -0.9 | 8.1 | 3.4 | TR | NW | 7.1 | 26 | 7 | 1010.6 | 72.0 | 6.6 | 0 | 0 | 0 | 0 | 1 | 0 | 4 |
| 5 | 13.3 | 3.5 | 1.7 | 7.9 | 0.8 | 0.0 | S | 10.3 | 31 | 8 | 1020.3 | 71.9 | 8.4 | 0 | 0 | 0 | 0 | 0 | 0 | 5 |
| 6 | 17.2 | 5.5 | 0.8 | 8.2 | 4.2 | TR | S | 7.3 | 30 | 4 | 1014.7 | 63.9 | 11.0 | 0 | 0 | 0 | 0 | 0 | 0 | 6 |
| 7 | 10.1 | 7.6 | 4.8 | 8.9 | 0.0 | 1.3 | NW | 4.2 | 19 | 8 | 1017.5 | 83.1 | 8.6 | 0 | 0 | 0 | 0 | 0 | 0 | 7 |
| 8 | 17.5 | 3.0 | -0.5 | 8.5 | 11.1 | 0.0 | W | 3.9 | 22 | 0 | 1029.5 | 67.9 | 9.8 | 0 | 0 | 0 | 0 | 0 | 0 | 8 |
| 9 | 18.1 | 4.3 | -1.0 | 9.2 | 4.8 | 0.0 | SE | 2.1 | 13 | 3 | 1033.1 | 69.0 | 11.1 | 0 | 0 | 0 | 0 | 0 | 0 | 9 |
| 10 | 18.0 | 4.7 | 0.1 | 9.9 | 9.2 | 0.0 | NE | 3.3 | 16 | 1 | 1032.9 | 68.4 | 11.0 | 0 | 0 | 0 | 0 | 0 | 0 | 10 |
| 11 | 15.0 | 3.5 | 1.3 | 10.1 | 7.1 | 0.0 | NE | 6.3 | 22 | 8 | 1029.5 | 70.7 | 8.4 | 0 | 0 | 0 | 0 | 0 | 0 | 11 |
| 12 | 13.9 | 5.4 | 5.1 | 10.4 | 3.3 | 0.0 | NE | 6.5 | 24 | 8 | 1027.1 | 77.0 | 8.2 | 0 | 0 | 0 | 0 | 0 | 0 | 12 |
| 13 | 15.1 | 2.8 | -0.5 | 10.0 | 10.7 | 0.0 | N | 7.1 | 28 | 1 | 1024.3 | 72.7 | 8.0 | 0 | 0 | 0 | 0 | 0 | 0 | 13 |
| 14 | 14.5 | 5.7 | 4.0 | 10.2 | 2.1 | 0.0 | NE | 4.9 | 17 | 8 | 1021.3 | 76.5 | 7.9 | 0 | 0 | 0 | 0 | 0 | 0 | 14 |
| 15 | 13.5 | 3.3 | -0.8 | 10.0 | 3.1 | 0.0 | N | 7.1 | 22 | 8 | 1024.0 | 74.9 | 8.0 | 0 | 0 | 0 | 0 | 0 | 0 | 15 |
| 16 | 14.7 | 4.4 | 1.1 | 10.3 | 6.6 | 0.0 | NE | 4.9 | 24 | 5 | 1027.2 | 72.1 | 8.3 | 0 | 0 | 0 | 0 | 0 | 0 | 16 |
| 17 | 17.5 | 2.2 | -2.0 | 10.1 | 12.3 | 0.0 | SW | 3.8 | 15 | 0 | 1021.1 | 64.5 | 9.5 | 0 | 0 | 0 | 0 | 0 | 0 | 17 |
| 18 | 19.0 | 3.9 | -1.4 | 10.5 | 9.9 | 0.0 | N | 3.4 | 17 | 0 | 1014.8 | 63.0 | 11.0 | 0 | 0 | 0 | 0 | 0 | 0 | 18 |
| 19 | 14.8 | 5.0 | 2.3 | 11.0 | 0.9 | TR | SE | 2.9 | 16 | 7 | 1016.4 | 74.9 | 8.8 | 0 | 0 | 0 | 0 | 0 | 0 | 19 |
| 20 | 14.7 | 2.0 | -1.3 | 10.9 | 10.4 | 0.0 | W | 8.0 | 30 | 0 | 1017.8 | 63.1 | 7.9 | 0 | 0 | 0 | 0 | 0 | 0 | 20 |
| 21 | 13.5 | 1.0 | -2.7 | 10.6 | 12.4 | 0.0 | NW | 4.9 | 16 | 0 | 1020.3 | 61.0 | 6.7 | 0 | 0 | 0 | 0 | 0 | 0 | 21 |
| 22 | 14.9 | 0.5 | -3.6 | 10.5 | 12.7 | 0.0 | NE | 2.7 | 15 | 0 | 1018.2 | 62.1 | 7.7 | 0 | 0 | 0 | 0 | 0 | 0 | 22 |
| 23 | 17.0 | 2.1 | -2.9 | 10.6 | 12.8 | 0.0 | SW | 4.4 | 17 | 1 | 1016.1 | 50.8 | 9.7 | 0 | 0 | 0 | 0 | 0 | 0 | 23 |
| 24 | 20.0 | 5.5 | 3.1 | 11.0 | 6.1 | 0.8 | S | 5.8 | 17 | 4 | 1017.8 | 50.5 | 12.0 | 0 | 0 | 0 | 0 | 0 | 0 | 24 |
| 25 | 18.7 | 8.8 | 6.5 | 11.6 | 1.8 | 4.0 | N | 6.0 | 29 | 8 | 1018.8 | 73.1 | 12.6 | 0 | 0 | 0 | 0 | 0 | 0 | 25 |
| 26 | 18.0 | 8.4 | 6.6 | 11.6 | 2.8 | 0.5 | W | 6.4 | 23 | 8 | 1024.0 | 75.5 | 12.7 | 0 | 0 | 0 | 0 | 0 | 0 | 26 |
| 27 | 19.6 | 6.1 | 1.4 | 11.8 | 7.0 | 0.0 | E | 3.0 | 14 | 0 | 1026.4 | 68.4 | 13.3 | 0 | 0 | 0 | 0 | 0 | 0 | 27 |
| 28 | 21.5 | 9.0 | 7.5 | 12.4 | 2.4 | 0.0 | S | 8.0 | 23 | 6 | 1019.1 | 60.4 | 15.3 | 0 | 0 | 0 | 0 | 0 | 0 | 28 |
| 29 | 18.5 | 11.4 | 10.1 | 12.9 | 0.1 | 2.3 | W | 4.7 | 18 | 6 | 1009.4 | 75.6 | 14.0 | 0 | 0 | 0 | 0 | 0 | 0 | 29 |
| 30 | 16.5 | 7.0 | 5.5 | 12.9 | 5.5 | 3.6 | SW | 9.0 | 26 | 2 | 1007.7 | 79.3 | 11.3 | 0 | 0 | 0 | 0 | 0 | 0 | 30 |
| Total/Mean | 15.6 | 4.6 | 1.6 | 10.1 | 172.7 | 17.3 | X | 5.7 | X | 4.0 | 1018.9 | 69.7 | 9.6 | 0 | 0 | 0 | 0 | 1 | 0 | Total/Mean |
| *Diff./% | +2.5 | +0.1 | 118% | 39% | *Diff./% | |||||||||||||||
| Date | Max. Temp. (°C) 09/09h | Min. Temp. (°C) 09/09h | Grass Min. Temp. (°C) 21/09h | Earth (30cms) Temp. (°C) 09h | Sun (Hours) 00/00h | R'fall (MM) 09/09h | Wind Dir'n 09h | Mean Wind Speed (MPH) 00/00h | Max. Gust Speed (MPH) 00/00h | Cloud Cover (Oktas) 09h | Mean MSL Air Pressure (mB) 00/00h | Mean Rel. Humd. (%) 00/00h | Mean Temp. (°C) 00/00h | Fog (vis. <1000m @ 09h) | Fog (vis. <200m @ 09h) | Snow or Rain and Snow 00/00h | Snow Lying @ 09h (>50% cover) | Hail 00/00h | Thunder 00/00h | Date |
Differences from average:
Differences from average shown in red. Reference periods used are as follows: Temperature 30 Years 1976/2005; rainfall 30 Years 1971/2000; sunshine 30 Years 1971/2000.
(*The differences from average quoted during the course of the month relate to the cumulative daily averages up to the date of the last observation, not the averages for the month as a whole)
Additional Data:
Rainfall Duration N/A
Air Frost Duration NIL hours
Graphs and Charts:
Click on the following links to view this month's graphs and charts.....
1. Daily Maximum, Minimum & Grass Minimum Temperatures
2. Daily Maximum & Minimum Temperatures (with 30 Year Comparative Means)
3. Daily Earth (30 cms Depth) Temperature @ 0900 GMT 4. Daily Rainfall 5. Daily Sunshine
6. Daily Maximum Gust & Mean Wind Speed 7. Daily Wind Direction @ 0900 GMT
8. Daily Mean MSL Air Pressure 9. Daily Mean Relative Humidity 10. Thermograph
11. Barograph 12. Hygrograph 13. Anemograph 14. Wind Direction
April 2010 Weather Review:
......and click on the link below for a text report of the April 2010 weather in Royston
April (since 1973) at Royston (Iceni) Weather Station:
Mean daily maximum temperature (30 years 1976/2005) 13.1°C
Mean daily minimum temperature (30 years 1976/2005) 4.5°C
Highest temperature 25.5°C (16th April 2003); lowest temperature -4.1°C (11th April 1978)
Lowest grass minimum temperature -9.4°C (4th April 1996)
Warmest April 2007 (Mean temperature 12.3°C); coldest April 1978 (Mean temperature 6.2°C)
Average April rainfall (30 years 1971/2000) 44.3 mm
Wettest April 1998 (Rainfall 120.7 mm); driest April 2007 (Rainfall 1.6 mm)
Wettest Day 9th April 1998 (Rainfall 32.0 mm);
Highest number of "rain days" (0.2 mm or more) 26 (1998); lowest number of "rain days" 3 (2007)
Highest number of days with thunder 7 (1998)
Highest number of air frosts 8 (1975)
Highest number of ground frosts 15 (1974, 1984)
Highest number of days with snow falling 5 (1975, 1986)
Highest number of days with snow lying (ground with more than 50% snow cover @ 0900 GMT) 2 (1978, 1983)
|
|
|
|
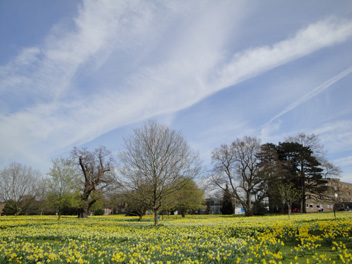
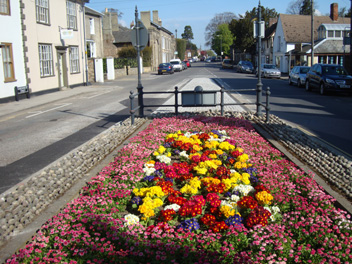
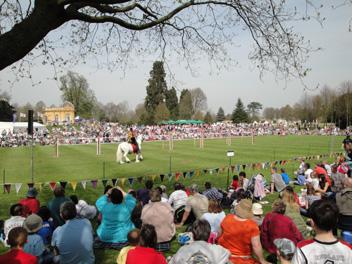
| Each Spring the Trent Park Campus of the University of Middlesex (55 km S of Royston) is transformed by a magnificent display of daffodils which covers several acres of ground. This picture taken at 1406 GMT on 13th April 2010 shows only a small portion of the overall display. The large country park Trent Park which surrounds the Campus dates back to the 14th Century when it was part of Enfield Chase , one of King Henry IVs hunting grounds. The afternoon sunshine on this day was turned rather hazy at times by a combination of high cirrus cloud and aircraft contrails as shown in the picture. At Royston a daily sunshine total of 10.7 hours was accumulated and a maximum temperature of 15.1°C achieved, after an overnight minimum of 2.8°C. | This is Kneesworth Street in Royston looking N from the Town Centre, as seen at 0829 GMT on 22nd April 2010. This street is, in fact, on the line of the old Roman Road Ermine Street which runs NNW to Huntingdon. The 35 km Royston to Huntingdon section of this ancient road is believed to be one of the longest stretches of straight road in the country. The centre of the road in the picture has seen a certain amount of remodelling in recent years, the new central reservation beyond the display of polyanthus and bellis having only just been completed. The sign on the fence at the end of the flowerbed pronounces entry to Royston Town Centre. At this time the temperature had already risen to 8.8°C after an overnight minimum of 0.5°C (at 0355 GMT). | The annual St. Georges Day Festival at Wrest Park (27 km SSW of Royston) sponsored by English Heritage took place over the weekend of 24th/25th April 2010. Saturday 24th was blessed with sunshine and early season warmth which attracted large crowds to this popular event. The main arena is shown in the picture and the horseman in evidence is introducing the jousting event in which he will act as adjudicator. At the rear of the spectators on the opposite side of the arena to the left can be seen the splendidly restored Orangery. A large array of cameos depicting life in medieval times was a significant feature of this event, as was the falconry display on the Bowling Green. At Royston the temperature reached 20.0°C (5.2°C above the 30 Year average for this day) and 6.1 hours sunshine was recorded. |
Return to Welcome to Royston (Iceni) Weather Station page
(This page last updated 10th May 2010 2012 GMT)