Royston (Iceni) Weather Station
Daily Weather Observations - MARCH 2010
(All Times GMT)
| Date | Max. Temp. (°C) 09/09h | Min. Temp. (°C) 09/09h | Grass Min. Temp. (°C) 21/09h | Earth (30cms) Temp. (°C) 09h | Sun (Hours) 00/00h | R'fall (MM) 09/09h | Wind Dir'n 09h | Mean Wind Speed (MPH) 00/00h | Max. Gust Speed (MPH) 00/00h | Cloud Cover (Oktas) 09h | Mean MSL Air Pressure (mB) 00/00h | Mean Rel. Humd. (%) 00/00h | Mean Temp. (°C) 00/00h | Fog (vis. <1000m @ 09h) | Fog (vis. <200m @ 09h) | Snow or Rain and Snow 00/00h | Snow Lying @ 09h (>50% cover) | Hail 00/00h | Thunder 00/00h | Date |
| 1 | 9.5 | 0.7 | -1.4 | 4.7 | 8.3 | 0.0 | W | 4.9 | 18 | 0 | 1010.1 | 75.5 | 3.6 | 0 | 0 | 0 | 0 | 0 | 0 | 1 |
| 2 | 10.1 | -0.3 | -5.3 | 4.4 | 8.0 | 0.0 | NW | 2.2 | 15 | 0 | 1022.4 | 76.6 | 3.2 | 0 | 0 | 0 | 0 | 0 | 0 | 2 |
| 3 | 6.5 | -0.7 | -4.2 | 4.0 | 0.6 | 0.0 | E | 2.8 | 16 | 8 | 1021.8 | 82.4 | 1.8 | 0 | 0 | 0 | 0 | 0 | 0 | 3 |
| 4 | 7.9 | -1.3 | -4.5 | 3.9 | 6.3 | 0.0 | NE | 3.7 | 18 | 3 | 1025.1 | 79.7 | 1.5 | 0 | 0 | 0 | 0 | 0 | 0 | 4 |
| 5 | 8.2 | -3.0 | -8.1 | 3.5 | 6.6 | TR | W | 6.4 | 20 | 0 | 1028.2 | 76.8 | 2.6 | 0 | 0 | 0 | 0 | 0 | 0 | 5 |
| 6 | 7.4 | 2.5 | -0.4 | 3.6 | 6.4 | 0.0 | NE | 4.6 | 17 | 7 | 1027.8 | 73.7 | 2.9 | 0 | 0 | 0 | 0 | 0 | 0 | 6 |
| 7 | 5.5 | -6.2 | -10.6 | 3.6 | 10.5 | 0.0 | NE | 2.5 | 19 | 0 | 1033.4 | 69.7 | -0.9 | 0 | 0 | 0 | 0 | 0 | 0 | 7 |
| 8 | 5.8 | -6.3 | -10.2 | 3.0 | 2.8 | 0.0 | NE | 3.7 | 16 | 6 | 1030.3 | 79.2 | 0.3 | 0 | 0 | 0 | 0 | 0 | 0 | 8 |
| 9 | 7.5 | 1.8 | 0.0 | 3.0 | 0.0 | TR | NE | 5.4 | 21 | 8 | 1029.7 | 85.1 | 4.1 | 0 | 0 | 0 | 0 | 0 | 0 | 9 |
| 10 | 5.0 | 1.6 | 0.4 | 3.8 | 0.1 | 0.0 | NE | 6.4 | 20 | 8 | 1029.1 | 77.8 | 3.2 | 0 | 0 | 0 | 0 | 0 | 0 | 10 |
| 11 | 5.1 | 0.0 | -5.1 | 4.0 | 0.1 | 0.5 | N | 3.4 | 18 | 8 | 1024.3 | 80.6 | 2.6 | 1 | 0 | 0 | 0 | 0 | 0 | 11 |
| 12 | 9.5 | 0.3 | -3.9 | 4.1 | 0.3 | 0.6 | W | 6.6 | 22 | 8 | 1021.4 | 81.9 | 4.9 | 0 | 0 | 0 | 0 | 0 | 0 | 12 |
| 13 | 10.4 | 2.4 | -0.4 | 4.6 | 2.9 | 0.0 | NW | 6.4 | 22 | 4 | 1028.7 | 77.6 | 6.0 | 0 | 0 | 0 | 0 | 0 | 0 | 13 |
| 14 | 12.1 | 2.5 | 0.0 | 5.4 | 4.1 | TR | NW | 8.6 | 25 | 6 | 1027.0 | 73.0 | 7.2 | 0 | 0 | 0 | 0 | 0 | 0 | 14 |
| 15 | 14.1 | 3.7 | 1.2 | 5.7 | 7.1 | 0.0 | W | 9.1 | 29 | 1 | 1025.8 | 69.3 | 7.4 | 0 | 0 | 0 | 0 | 0 | 0 | 15 |
| 16 | 13.2 | 2.9 | -0.1 | 6.0 | 3.8 | 0.0 | W | 6.0 | 18 | 7 | 1024.6 | 63.1 | 7.5 | 0 | 0 | 0 | 0 | 0 | 0 | 16 |
| 17 | 14.1 | 4.1 | 2.5 | 6.0 | 1.0 | 0.0 | SW | 8.8 | 23 | 6 | 1020.6 | 70.4 | 9.0 | 0 | 0 | 0 | 0 | 0 | 0 | 17 |
| 18 | 17.1 | 6.4 | 5.4 | 6.5 | 0.0 | 0.2 | S | 11.0 | 31 | 8 | 1013.7 | 69.9 | 11.2 | 0 | 0 | 0 | 0 | 0 | 0 | 18 |
| 19 | 13.3 | 8.5 | 6.8 | 7.2 | 3.8 | 3.6 | SW | 9.0 | 25 | 3 | 1009.6 | 85.2 | 10.9 | 0 | 0 | 0 | 0 | 0 | 0 | 19 |
| 20 | 13.6 | 11.0 | 9.6 | 7.9 | 0.2 | 2.1 | S | 9.7 | 29 | 8 | 1002.8 | 88.8 | 11.5 | 0 | 0 | 0 | 0 | 0 | 0 | 20 |
| 21 | 14.1 | 2.7 | -0.4 | 8.0 | 7.5 | 0.0 | NW | 5.3 | 18 | 0 | 1015.5 | 74.9 | 8.3 | 0 | 0 | 0 | 0 | 0 | 0 | 21 |
| 22 | 12.6 | 5.1 | 4.0 | 8.0 | 3.9 | 0.4 | S | 10.5 | 31 | 1 | 1016.4 | 79.1 | 8.5 | 0 | 0 | 0 | 0 | 0 | 0 | 22 |
| 23 | 13.5 | 2.8 | -1.5 | 7.9 | 4.8 | 0.9 | S | 6.4 | 21 | 5 | 1015.1 | 83.0 | 8.2 | 0 | 0 | 0 | 0 | 0 | 0 | 23 |
| 24 | 17.3 | 8.1 | 7.1 | 8.1 | 2.9 | 4.2 | SE | 5.1 | 21 | 8 | 1004.8 | 79.2 | 11.6 | 0 | 0 | 0 | 0 | 0 | 0 | 24 |
| 25 | 15.5 | 9.9 | 8.2 | 8.9 | 0.3 | 2.6 | S | 6.5 | 27 | 8 | 998.6 | 87.0 | 11.2 | 0 | 0 | 0 | 0 | 0 | 0 | 25 |
| 26 | 13.3 | 6.9 | 5.4 | 9.0 | 2.9 | 0.7 | SW | 10.4 | 31 | 6 | 999.9 | 75.8 | 9.4 | 0 | 0 | 0 | 0 | 0 | 0 | 26 |
| 27 | 13.1 | 7.1 | 5.5 | 9.0 | 1.6 | 0.4 | SW | 7.7 | 22 | 7 | 1003.8 | 77.5 | 9.2 | 0 | 0 | 0 | 0 | 0 | 0 | 27 |
| 28 | 14.0 | 5.4 | 3.0 | 8.9 | 6.9 | 2.6 | SW | 8.9 | 24 | 4 | 1006.3 | 70.0 | 9.3 | 0 | 0 | 0 | 0 | 0 | 0 | 28 |
| 29 | 12.6 | 6.4 | 5.7 | 9.1 | 0.3 | 1.2 | SE | 5.8 | 27 | 8 | 998.2 | 88.0 | 9.4 | 0 | 0 | 0 | 0 | 0 | 0 | 29 |
| 30 | 12.9 | 8.4 | 5.9 | 9.4 | 0.7 | 4.8 | S | 9.9 | 33 | 8 | 986.0 | 83.9 | 8.1 | 0 | 0 | 0 | 0 | 0 | 0 | 30 |
| 31 | 6.4 | 3.0 | 2.5 | 8.9 | 0.0 | 0.1 | SW | 12.9 | 34 | 8 | 988.7 | 78.2 | 4.4 | 0 | 0 | 0 | 0 | 0 | 0 | 31 |
| Total/Mean | 11.0 | 3.1 | 0.6 | 6.1 | 104.5 | 24.9 | X | 6.8 | X | 5.2 | 1015.8 | 77.8 | 6.4 | 1 | 0 | 0 | 0 | 0 | 0 | Total/Mean |
| *Diff./% | +0.6 | -0.4 | 98% | 59% | *Diff./% | |||||||||||||||
| Date | Max. Temp. (°C) 09/09h | Min. Temp. (°C) 09/09h | Grass Min. Temp. (°C) 21/09h | Earth (30cms) Temp. (°C) 09h | Sun (Hours) 00/00h | R'fall (MM) 09/09h | Wind Dir'n 09h | Mean Wind Speed (MPH) 00/00h | Max. Gust Speed (MPH) 00/00h | Cloud Cover (Oktas) 09h | Mean MSL Air Pressure (mB) 00/00h | Mean Rel. Humd. (%) 00/00h | Mean Temp. (°C) 00/00h | Fog (vis. <1000m @ 09h) | Fog (vis. <200m @ 09h) | Snow or Rain and Snow 00/00h | Snow Lying @ 09h (>50% cover) | Hail 00/00h | Thunder 00/00h | Date |
Differences from average:
Differences from average shown in red. Reference periods used are as follows: Temperature 30 Years 1976/2005; rainfall 30 Years 1971/2000; sunshine 30 Years 1971/2000.
(*The differences from average quoted during the course of the month relate to the cumulative daily averages up to the date of the last observation, not the averages for the month as a whole)
Additional Data:
Rainfall Duration N/A
Air Frost Duration 58.8 hours
Graphs and Charts:
Click on the following links to view this month's graphs and charts.....
1. Daily Maximum, Minimum & Grass Minimum Temperatures
2. Daily Maximum & Minimum Temperatures (with 30 Year Comparative Means)
3. Daily Earth (30 cms Depth) Temperature @ 0900 GMT 4. Daily Rainfall 5. Daily Sunshine
6. Daily Maximum Gust & Mean Wind Speed 7. Daily Wind Direction @ 0900 GMT
8. Daily Mean MSL Air Pressure 9. Daily Mean Relative Humidity 10. Thermograph
11. Barograph 12. Hygrograph 13. Anemograph 14. Wind Direction
March 2010 Weather Review:
......and click on the link below for a text report of the March 2010 weather in Royston
March (since 1973) at Royston (Iceni) Weather Station:
Mean day maximum temperature (30 years 1976/2005) 10.4°C
Mean night minimum temperature (30 years 1976/2005) 3.5°C
Highest temperature 21.6°C (17th March 1990); lowest temperature -6.6°C (3rd March 1986)
Lowest grass minimum temperature -13.7°C (3rd March 1986)
Warmest March 1997 (Mean temperature 9.1°C); coldest March 1987 (Mean temperature 4.3°C)
Average March rainfall (30 years 1971/2000) 42.5 mm
Wettest March 1979 (Rainfall 97.8 mm); driest March 1997 (Rainfall 8.1 mm)
Wettest Day 2nd March 1995 (Rainfall 30.1 mm);
Highest number of "rain days" (0.2 mm or more) 25 (1981); lowest number of "rain days" 3 (2003)
Highest number of days with thunder 2 (1986, 1995)
Highest number of air frosts 15 (1987)
Highest number of ground frosts 21 (1987)
Highest number of days with snow falling 11 (1979)
Highest number of days with snow lying (ground with more than 50% snow cover @ 0900 GMT) 4 (1986)
|
|
|
|
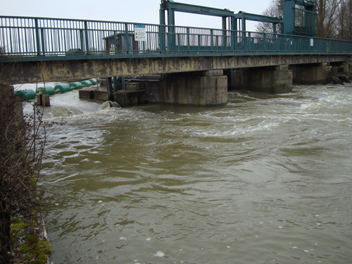
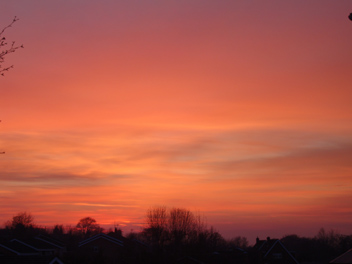
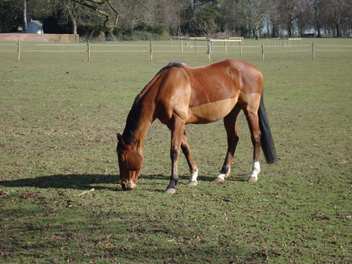
| In the adjacent (Nene) river catchment to the Great Ouse catchment in which Royston lies this was the scene at Orton Staunch, Peterborough (65 km NNW of Royston) on 3rd March 2010 (at 1403 GMT). Although the first half of March was very dry with virtually no rainfall at Royston, the wet second half of February resulted in considerably raised river levels in the region. In this picture the normal waterfalls at this location have been submerged under the torrent with water being allowed free flow through the locks to reduce water levels upstream. This is the last but one set of locks before the sea and on this occasion downstream water levels are raised to flood proportions as indicated here. | On 5th March 2010 Royston experienced a colourful sunset which initially was confined to the horizon where the setting sun was capped with an array of bright golden bands. Once these had dissipated and the sun had disappeared from view the dull red effect illustrated in this photograph (taken at 1751 GMT) spread upwards to illuminate the thin cloud covering this part of the celestial dome. The weather conditions at sunset on this day were wind strength 6 knots gusting to 10 knots (from WNW) and temperature 5.5°C (after a day maximum of 8.2°C). The day had been fairly sunny with a total sunshine of 6.6 hours being accumulated. This had been preceded by an overnight minimum temperature of -3.0°C. | If this horse (as photographed at Burloes, Royston on 15th March 2010 at 0949 GMT) is looking for new shoots of grass it will be unlucky as the weather has prevented the growth of any new season grass so far. With each of the three Winter months December to February experiencing below average temperatures the first half of March has been even colder relatively speaking with the mean temperature being over 3°C below normal! Milder conditions thereafter this month have belatedly stimulated the growth of grass in the district. The sunshine apparent in this picture lasted for much of the day and total sunshine of 7.1 hours was recorded. The temperature rose to a maximum of 14.1°C on this day after an overnight minimum of 3.7°C.. |
Return to Welcome to Royston (Iceni) Weather Station page
(This page last updated 1st April 2010 2036 GMT)