Royston (Iceni) Weather Station
Daily Weather Observations - December 2009
(All Times GMT)
| Date | Max. Temp. (°C) 09/09h | Min. Temp. (°C) 09/09h | Grass Min. Temp. (°C) 21/09h | Earth (30cms) Temp. (°C) 09h | Sun (Hours) 00/00h | R'fall (MM) 09/09h | Wind Dir'n 09h | Mean Wind Speed (MPH) 00/00h | Max. Gust Speed (MPH) 00/00h | Cloud Cover (Oktas) 09h | Mean MSL Air Pressure (mB) 00/00h | Mean Rel. Humd. (%) 00/00h | Mean Temp. (°C) 00/00h | Fog (vis. <1000m @ 09h) | Fog (vis. <200m @ 09h) | Snow or Rain and Snow 00/00h | Snow Lying @ 09h (>50% cover) | Hail 00/00h | Thunder 00/00h | Date |
| 1 | 7.6 | -1.1 | -5.1 | 7.0 | 5.9 | 1.9 | W | 3.4 | 19 | 2 | 1010.4 | 87.7 | 2.2 | 0 | 0 | 0 | 0 | 0 | 0 | 1 |
| 2 | 10.0 | 4.5 | 3.7 | 6.5 | 1.5 | 2.8 | S | 5.9 | 24 | 8 | 997.7 | 90.4 | 7.4 | 0 | 0 | 0 | 0 | 0 | 0 | 2 |
| 3 | 7.3 | 6.0 | 3.5 | 7.3 | 0.0 | 2.7 | SW | 8.4 | 28 | 8 | 996.2 | 88.3 | 5.7 | 0 | 0 | 0 | 0 | 0 | 0 | 3 |
| 4 | 9.1 | 2.0 | 0.0 | 7.0 | 5.6 | 2.7 | W | 8.5 | 22 | 1 | 1005.5 | 82.9 | 4.1 | 0 | 0 | 0 | 0 | 0 | 0 | 4 |
| 5 | 12.2 | 4.7 | 4.3 | 6.8 | 4.0 | 5.2 | SW | 9.2 | 24 | 2 | 998.1 | 89.1 | 8.6 | 0 | 0 | 0 | 0 | 0 | 0 | 5 |
| 6 | 11.7 | 10.4 | 9.5 | 7.5 | 4.7 | 4.6 | SW | 12.4 | 36 | 8 | 995.3 | 81.7 | 9.5 | 0 | 0 | 0 | 0 | 0 | 0 | 6 |
| 7 | 10.8 | 6.2 | 4.3 | 7.4 | 0.0 | 2.8 | S | 9.4 | 29 | 8 | 998.9 | 84.7 | 7.8 | 0 | 0 | 0 | 0 | 0 | 0 | 7 |
| 8 | 10.5 | 4.9 | 3.1 | 7.5 | 3.6 | 1.4 | SW | 9.4 | 26 | 3 | 1008.7 | 85.0 | 7.3 | 0 | 0 | 0 | 0 | 0 | 0 | 8 |
| 9 | 10.5 | 8.4 | 6.7 | 7.5 | 3.7 | 0.3 | S | 6.8 | 22 | 2 | 1016.9 | 92.7 | 9.6 | 0 | 0 | 0 | 0 | 0 | 0 | 9 |
| 10 | 9.3 | 5.5 | 2.7 | 7.8 | 6.8 | 0.1 | W | 6.7 | 25 | 0 | 1026.6 | 87.6 | 6.6 | 0 | 0 | 0 | 0 | 0 | 0 | 10 |
| 11 | 5.0 | 1.1 | -3.5 | 6.8 | 0.0 | 0.1 | N | 1.6 | 9 | 8 | 1033.0 | 94.8 | 3.7 | 1 | 0 | 0 | 0 | 0 | 0 | 11 |
| 12 | 7.6 | 3.2 | 0.6 | 6.9 | 4.9 | 0.0 | NW | 3.2 | 16 | 7 | 1032.0 | 92.4 | 4.5 | 0 | 0 | 0 | 0 | 0 | 0 | 12 |
| 13 | 6.4 | 2.0 | -1.4 | 6.5 | 1.8 | 0.3 | N | 2.4 | 16 | 6 | 1028.0 | 91.9 | 3.5 | 0 | 0 | 0 | 0 | 0 | 0 | 13 |
| 14 | 4.5 | 1.0 | -2.0 | 6.3 | 0.3 | 1.9 | NW | 1.2 | 10 | 8 | 1021.9 | 92.0 | 3.1 | 1 | 0 | 0 | 0 | 0 | 0 | 14 |
| 15 | 2.4 | 0.1 | -0.9 | 6.3 | 3.6 | TR | SE | 2.9 | 14 | 5 | 1018.9 | 85.8 | 0.9 | 0 | 0 | 0 | 0 | 0 | 0 | 15 |
| 16 | 3.7 | -2.0 | -6.0 | 5.5 | 0.0 | 3.2 | SW | 4.8 | 17 | 8 | 1011.2 | 92.4 | 0.9 | 0 | 0 | 1 | 0 | 0 | 0 | 16 |
| 17 | 3.5 | -0.5 | -3.6 | 5.2 | 3.0 | 12.7 | N | 7.8 | 40 | 4 | 1009.4 | 89.8 | 0.8 | 0 | 0 | 1 | 0 | 0 | 0 | 17 |
| 18 | 0.2 | -3.0 | -5.4 | 4.9 | 3.4 | TR | NE | 6.1 | 30 | 2 | 1014.5 | 93.5 | -1.1 | 0 | 0 | 1 | 1 | 0 | 0 | 18 |
| 19 | 0.9 | -5.1 | -10.1 | 4.6 | 6.6 | 2.2 | W | 7.0 | 23 | 0 | 1009.7 | 90.0 | -2.8 | 0 | 0 | 1 | 1 | 0 | 0 | 19 |
| 20 | 0.3 | -4.5 | -8.5 | 4.5 | 6.7 | 0.0 | W | 9.3 | 24 | 0 | 997.4 | 83.2 | -1.1 | 0 | 0 | 1 | 1 | 0 | 0 | 20 |
| 21 | 1.3 | -3.5 | -6.1 | 4.4 | 1.1 | 4.8 | S | 5.7 | 24 | 1 | 990.7 | 88.5 | -0.5 | 0 | 0 | 1 | 1 | 0 | 0 | 21 |
| 22 | 0.5 | -1.0 | -0.6 | 4.2 | 4.9 | 0.0 | SW | 5.1 | 22 | 8 | 985.8 | 92.1 | -0.5 | 0 | 0 | 0 | 1 | 0 | 0 | 22 |
| 23 | 3.0 | -3.5 | -5.0 | 4.0 | 2.6 | 2.8 | S | 7.1 | 22 | 0 | 990.0 | 92.5 | -0.1 | 0 | 0 | 0 | 1 | 0 | 0 | 23 |
| 24 | 3.8 | 1.3 | 0.0 | 3.9 | 0.1 | 1.1 | S | 4.7 | 19 | 8 | 987.5 | 92.6 | 2.3 | 0 | 0 | 0 | 1 | 0 | 0 | 24 |
| 25 | 6.5 | 0.5 | 0.0 | 3.9 | 4.0 | 0.1 | W | 8.3 | 27 | 8 | 996.6 | 91.8 | 1.7 | 0 | 0 | 0 | 1 | 0 | 0 | 25 |
| 26 | 8.2 | 2.0 | 0.7 | 3.9 | 5.7 | 0.0 | SW | 10.5 | 27 | 6 | 998.9 | 87.6 | 5.9 | 0 | 0 | 0 | 0 | 0 | 0 | 26 |
| 27 | 6.5 | 3.9 | 2.1 | 4.1 | 2.8 | 0.0 | SW | 12.1 | 30 | 1 | 997.4 | 81.3 | 4.5 | 0 | 0 | 0 | 0 | 0 | 0 | 27 |
| 28 | 3.6 | -0.3 | -4.0 | 4.1 | 4.8 | 0.0 | CALM | 1.8 | 19 | 2 | 1004.1 | 89.4 | 1.2 | 0 | 0 | 0 | 0 | 0 | 0 | 28 |
| 29 | 3.8 | -1.0 | -4.0 | 3.6 | 0.0 | 14.5 | NE | 4.4 | 19 | 8 | 996.1 | 92.2 | 2.0 | 0 | 0 | 0 | 0 | 0 | 0 | 29 |
| 30 | 3.4 | 0.6 | -0.1 | 3.7 | 0.0 | 8.1 | NE | 5.5 | 19 | 8 | 993.4 | 94.9 | 2.5 | 0 | 0 | 0 | 0 | 0 | 0 | 30 |
| 31 | 3.7 | 1.9 | 1.1 | 4.0 | 0.9 | 1.4 | NE | 6.6 | 24 | 8 | 999.9 | 89.3 | 2.1 | 0 | 0 | 1 | 0 | 1 | 0 | 31 |
| Total/Mean | 5.7 | 1.4 | -0.8 | 5.6 | 92.9 | 77.7 | X | 6.4 | X | 4.8 | 1005.5 | 89.3 | 3.3 | 2 | 0 | 7 | 8 | 1 | 0 | Total/Mean |
| *Diff./% | -1.4 | -1.6 | 195% | 145% | *Diff./% | |||||||||||||||
| Date | Max. Temp. (°C) 09/09h | Min. Temp. (°C) 09/09h | Grass Min. Temp. (°C) 21/09h | Earth (30cms) Temp. (°C) 09h | Sun (Hours) 00/00h | R'fall (MM) 09/09h | Wind Dir'n 09h | Mean Wind Speed (MPH) 00/00h | Max. Gust Speed (MPH) 00/00h | Cloud Cover (Oktas) 09h | Mean MSL Air Pressure (mB) 00/00h | Mean Rel. Humd. (%) 00/00h | Mean Temp. (°C) 00/00h | Fog (vis. <1000m @ 09h) | Fog (vis. <200m @ 09h) | Snow or Rain and Snow 00/00h | Snow Lying @ 09h (>50% cover) | Hail 00/00h | Thunder 00/00h | Date |
Differences from average:
Differences from average shown in red. Reference periods used are as follows: Temperature 30 Years 1976/2005; rainfall 30 Years 1971/2000; sunshine 30 Years 1971/2000.
(*The differences from average quoted during the course of the month relate to the cumulative daily averages up to the date of the last observation, not the averages for the month as a whole)
Additional Data:
Rainfall Duration 85.2 hours
Air Frost Duration 138.8 hours
Graphs and Charts:
Click on the following links to view this month's graphs and charts.....
1. Daily Maximum, Minimum & Grass Minimum Temperatures
2. Daily Maximum & Minimum Temperatures (with 30 Year Comparative Means)
3. Daily Earth (30 cms Depth) Temperature @ 0900 GMT 4. Daily Rainfall 5. Daily Sunshine
6. Daily Maximum Gust & Mean Wind Speed 7. Daily Wind Direction @ 0900 GMT
8. Daily Mean MSL Air Pressure 9. Daily Mean Relative Humidity 10. Thermograph
11. Barograph 12. Hygrograph 13. Anemograph 14. Wind Direction
15. Sunshine Duration 16. Rainfall Intensity & Duration
December 2009 Weather Review:
......and click on the link below for a text report of the December 2009 weather in Royston
December (since 1972) at Royston (Iceni) Weather Station:
Mean day maximum temperature (30 years 1976/2005) 7.1°C
Mean night minimum temperature (30 years 1976/2005) 3.0°C
Highest temperature 15.1°C (2nd December 1985); lowest temperature -9.8°C (29th December 1995)
Lowest grass minimum temperature -14.6°C (13th December 1981)
Warmest December 1974 (Mean temperature 7.8°C); coldest December 1981 (Mean temperature 0.4°C)
Average December rainfall (30 years 1971/2000) 52.8 mm
Wettest December 1989 (Rainfall 122.4 mm); driest December 1991 (Rainfall 10.3 mm)
Wettest Day 27th December 1979 (Rainfall 31.5 mm);
Highest number of "rain days" (0.2 mm or more) 22 (1978); lowest number of "rain days" 7 (2004)
Highest number of days with thunder 3 (1989)
Highest number of air frosts 20 (1981)
Highest number of ground frosts 25 (1981)
Highest number of days with snow falling 10 (1981)
Highest number of days with snow lying (ground with more than 50% snow cover @ 0900 GMT) 23 (1981)
|
|
|
|
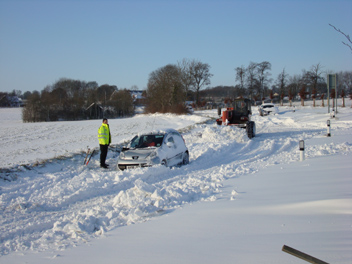
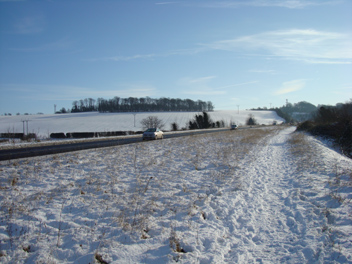
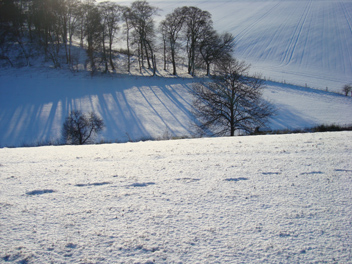
| In the late evening of 17th December 2009 a small area of low pressure centred over Belgium drew in heavy snow showers from the North Sea across East Anglia with the result that at 0900 GMT the next day a level depth of snow of 16 cm was measured at Royston. The B1039 road between Royston and Barley was badly affected by snow drifting off the fields on to the road which was closed to traffic after a number of vehicles became stuck and had to be rescued. In this picture of the road a few hundred metres east of Eagle Tavern, Royston (taken at 1024 GMT on 18th December 2009 in a temperature of -3.2°C) farm vehicles are assisting with the recovery operations and clearing the carriageway. | This view (on 19th December 2009) is of the single carriageway section of the A505 Royston by-pass looking eastwards along the long climb towards the cutting through Hyde Hill. The A505 here is essentially clear of snow after the previous day's heavy fall although conditions remain icy as the temperature is still -3.0°C at 1148 GMT when this photograph was taken. The seemingly very wide verge is the space reserved for the second carriageway of this road to be built should the need arise. A heavy snowfall in mid-December is very unusual, the last such occasion being as long ago as 1981. The temperature later achieved a maximum of 0.9°C after an overnight minimum of -5.1°C, and sunshine for the day was 6.6 hours. | This is the third day (20th December 2009) of the mid-December snowfall event in Royston and one of the most popular places around is Therfield Heath, Royston which is thronged with people using the many steep slopes for tobogganing and skiing, whilst on more level ground kites are flying and pulling along the skiers! The location pictured above is a quieter spot on the Pen Hills at the western end of the Heath, looking down into an adjacent valley. The time is 1419 GMT and although it is a sunny day the temperature is -0.3°C. The wind chill factor is quite pronounced in the SW wind of mean speed 10 knots gusting to 14 knots. The maximum temperature for the day was 0.3°C and total sunshine was 6.7 hours. |
Return to Welcome to Royston (Iceni) Weather Station page
(This page last updated 9th January 2010 2102 GMT)