Royston (Iceni) Weather Station
Daily Weather Observations - September 2009
(All Times GMT)
| Date | Max. Temp. (°C) 09/09h | Min. Temp. (°C) 09/09h | Grass Min. Temp. (°C) 21/09h | Earth (30cms) Temp. (°C) 09h | Sun (Hours) 00/00h | R'fall (MM) 09/09h | Wind Dir'n 09h | Mean Wind Speed (MPH) 00/00h | Max. Gust Speed (MPH) 00/00h | Cloud Cover (Oktas) 09h | Mean MSL Air Pressure (mB) 00/00h | Mean Rel. Humd. (%) 00/00h | Mean Temp. (°C) 00/00h | Fog (vis. <1000m @ 09h) | Fog (vis. <200m @ 09h) | Snow or Rain and Snow 00/00h | Snow Lying @ 09h (>50% cover) | Hail 00/00h | Thunder 00/00h | Date |
| 1 | 22.1 | 13.4 | 11.6 | 18.0 | 8.5 | 1.5 | SW | 9.6 | 33 | 2 | 1004.6 | 67.1 | 16.5 | 0 | 0 | 0 | 0 | 0 | 0 | 1 |
| 2 | 18.5 | 12.2 | 10.6 | 17.5 | 0.6 | 5.8 | S | 8.6 | 29 | 8 | 1003.9 | 81.7 | 14.8 | 0 | 0 | 0 | 0 | 0 | 0 | 2 |
| 3 | 19.2 | 12.6 | 11.4 | 17.2 | 8.0 | 0.0 | W | 15.0 | 39 | 3 | 995.9 | 69.8 | 14.6 | 0 | 0 | 0 | 0 | 0 | 0 | 3 |
| 4 | 18.2 | 9.8 | 8.0 | 16.8 | 5.2 | 0.0 | W | 11.8 | 33 | 2 | 1005.9 | 69.2 | 13.6 | 0 | 0 | 0 | 0 | 0 | 0 | 4 |
| 5 | 19.8 | 9.9 | 7.4 | 16.6 | 6.5 | 0.0 | W | 8.7 | 25 | 0 | 1019.1 | 71.2 | 14.3 | 0 | 0 | 0 | 0 | 0 | 0 | 5 |
| 6 | 19.8 | 12.5 | 11.9 | 16.5 | 3.1 | 0.0 | SW | 7.3 | 20 | 4 | 1020.1 | 67.8 | 15.2 | 0 | 0 | 0 | 0 | 0 | 0 | 6 |
| 7 | 20.2 | 13.7 | 12.0 | 16.7 | 0.6 | 0.0 | SW | 5.9 | 20 | 8 | 1016.4 | 80.6 | 17.1 | 0 | 0 | 0 | 0 | 0 | 0 | 7 |
| 8 | 27.1 | 17.0 | 15.4 | 17.0 | 7.5 | 0.0 | SW | 8.0 | 26 | 8 | 1016.2 | 74.6 | 20.6 | 0 | 0 | 0 | 0 | 0 | 0 | 8 |
| 9 | 20.3 | 12.5 | 10.1 | 17.5 | 5.4 | 0.0 | N | 4.0 | 17 | 6 | 1027.6 | 70.7 | 14.5 | 0 | 0 | 0 | 0 | 0 | 0 | 9 |
| 10 | 19.5 | 6.5 | 2.6 | 16.6 | 8.1 | 0.0 | NE | 3.7 | 19 | 2 | 1034.9 | 78.2 | 12.2 | 0 | 0 | 0 | 0 | 0 | 0 | 10 |
| 11 | 20.9 | 7.1 | 3.0 | 15.9 | 5.4 | 0.0 | NE | 3.0 | 17 | 7 | 1035.2 | 79.7 | 13.1 | 0 | 0 | 0 | 0 | 0 | 0 | 11 |
| 12 | 22.5 | 8.1 | 4.9 | 16.3 | 11.4 | 0.0 | N | 1.9 | 14 | 4 | 1029.6 | 75.4 | 14.3 | 0 | 0 | 0 | 0 | 0 | 0 | 12 |
| 13 | 16.2 | 8.0 | 4.0 | 16.0 | 0.1 | 0.0 | N | 4.4 | 25 | 8 | 1027.1 | 80.5 | 12.5 | 0 | 0 | 0 | 0 | 0 | 0 | 13 |
| 14 | 19.1 | 11.5 | 10.7 | 15.8 | 2.4 | 0.1 | N | 5.9 | 23 | 6 | 1024.9 | 77.4 | 14.4 | 0 | 0 | 0 | 0 | 0 | 0 | 14 |
| 15 | 16.9 | 12.1 | 9.6 | 16.0 | 0.1 | 0.9 | N | 7.4 | 24 | 8 | 1020.5 | 86.6 | 14.7 | 0 | 0 | 0 | 0 | 0 | 0 | 15 |
| 16 | 19.5 | 12.7 | 12.0 | 15.7 | 5.1 | 0.0 | NE | 7.8 | 28 | 3 | 1021.8 | 75.4 | 14.7 | 0 | 0 | 0 | 0 | 0 | 0 | 16 |
| 17 | 16.2 | 11.4 | 9.0 | 15.9 | 0.0 | 0.0 | NE | 4.4 | 17 | 8 | 1021.5 | 69.5 | 13.5 | 0 | 0 | 0 | 0 | 0 | 0 | 17 |
| 18 | 21.2 | 9.4 | 5.1 | 15.5 | 11.5 | 0.0 | NE | 1.9 | 13 | 3 | 1017.5 | 72.3 | 14.4 | 0 | 0 | 0 | 0 | 0 | 0 | 18 |
| 19 | 22.5 | 11.0 | 7.4 | 15.7 | 3.7 | 0.0 | N | 1.0 | 11 | 7 | 1014.9 | 76.4 | 16.0 | 0 | 0 | 0 | 0 | 0 | 0 | 19 |
| 20 | 21.5 | 12.8 | 10.0 | 16.2 | 6.8 | 0.0 | NE | 2.9 | 13 | 6 | 1021.3 | 68.6 | 15.3 | 0 | 0 | 0 | 0 | 0 | 0 | 20 |
| 21 | 19.6 | 10.7 | 7.9 | 16.1 | 3.5 | 0.0 | W | 5.5 | 17 | 7 | 1023.3 | 70.6 | 14.7 | 0 | 0 | 0 | 0 | 0 | 0 | 21 |
| 22 | 21.3 | 12.2 | 10.5 | 16.0 | 8.1 | TR | SW | 9.8 | 25 | 2 | 1021.8 | 75.8 | 16.4 | 0 | 0 | 0 | 0 | 0 | 0 | 22 |
| 23 | 18.9 | 13.5 | 11.6 | 16.3 | 0.5 | 0.0 | W | 5.3 | 20 | 8 | 1023.8 | 75.7 | 15.3 | 0 | 0 | 0 | 0 | 0 | 0 | 23 |
| 24 | 20.8 | 9.1 | 6.0 | 16.0 | 10.4 | 0.0 | W | 3.8 | 15 | 0 | 1024.6 | 72.0 | 13.5 | 0 | 0 | 0 | 0 | 0 | 0 | 24 |
| 25 | 20.5 | 8.7 | 5.0 | 15.5 | 11.2 | 0.0 | W | 3.3 | 16 | 0 | 1025.7 | 71.8 | 13.0 | 0 | 0 | 0 | 0 | 0 | 0 | 25 |
| 26 | 19.2 | 8.9 | 5.5 | 15.4 | 5.4 | 0.0 | W | 1.9 | 11 | 7 | 1025.8 | 75.6 | 12.8 | 0 | 0 | 0 | 0 | 0 | 0 | 26 |
| 27 | 21.6 | 8.0 | 4.9 | 14.6 | 10.3 | 0.0 | NW | 2.6 | 11 | 0 | 1026.1 | 79.6 | 13.3 | 0 | 0 | 0 | 0 | 0 | 0 | 27 |
| 28 | 18.2 | 11.0 | 7.5 | 14.7 | 0.5 | 0.0 | W | 5.6 | 19 | 8 | 1024.1 | 79.3 | 14.6 | 0 | 0 | 0 | 0 | 0 | 0 | 28 |
| 29 | 22.6 | 11.5 | 8.8 | 14.8 | 3.2 | 0.0 | W | 5.7 | 18 | 8 | 1020.5 | 77.0 | 15.5 | 0 | 0 | 0 | 0 | 0 | 0 | 29 |
| 30 | 19.2 | 14.4 | 13.5 | 15.3 | 1.1 | 0.0 | W | 4.7 | 15 | 8 | 1017.1 | 76.1 | 15.9 | 0 | 0 | 0 | 0 | 0 | 0 | 30 |
| Total/Mean | 20.1 | 11.1 | 8.6 | 16.1 | 154.0 | 8.3 | X | 5.7 | X | 5.0 | 1020.4 | 74.9 | 14.7 | 0 | 0 | 0 | 0 | 0 | 0 | Total/Mean |
| *Diff./% | +1.1 | +0.3 | 109% | 15% | *Diff./% | |||||||||||||||
| Date | Max. Temp. (°C) 09/09h | Min. Temp. (°C) 09/09h | Grass Min. Temp. (°C) 21/09h | Earth (30cms) Temp. (°C) 09h | Sun (Hours) 00/00h | R'fall (MM) 09/09h | Wind Dir'n 09h | Mean Wind Speed (MPH) 00/00h | Max. Gust Speed (MPH) 00/00h | Cloud Cover (Oktas) 09h | Mean MSL Air Pressure (mB) 00/00h | Mean Rel. Humd. (%) 00/00h | Mean Temp. (°C) 00/00h | Fog (vis. <1000m @ 09h) | Fog (vis. <200m @ 09h) | Snow or Rain and Snow 00/00h | Snow Lying @ 09h (>50% cover) | Hail 00/00h | Thunder 00/00h | Date |
Differences from average:
Differences from average shown in red. Reference periods used are as follows: Temperature 30 Years 1976/2005; rainfall 30 Years 1971/2000; sunshine 30 Years 1971/2000.
(*The differences from average quoted during the course of the month relate to the cumulative daily averages up to the date of the last observation, not the averages for the month as a whole)
Additional Data:
Rainfall Duration 6.9 hours
Air Frost Duration NIL hours
Graphs and Charts:
Click on the following links to view this month's graphs and charts.....
1. Daily Maximum, Minimum & Grass Minimum Temperatures
2. Daily Maximum & Minimum Temperatures (with 30 Year Comparative Means)
3. Daily Earth (30 cms Depth) Temperature @ 0900 GMT 4. Daily Rainfall 5. Daily Sunshine
6. Daily Maximum Gust & Mean Wind Speed 7. Daily Wind Direction @ 0900 GMT
8. Daily Mean MSL Air Pressure 9. Daily Mean Relative Humidity 10. Thermograph
11. Barograph 12. Hygrograph 13. Anemograph 14. Wind Direction
15. Sunshine Duration 16. Rainfall Intensity & Duration
September 2009 Weather Review:
......and click on the link below for a text report of the September 2009 weather in Royston
September (since 1972) at Royston (Iceni) Weather Station:
Mean day maximum temperature (30 years 1976/2005) 19.0°C
Mean night minimum temperature (30 years 1976/2005) 10.8°C
Highest temperature 29.6°C (5th September 1973); lowest temperature 2.0°C (22nd September 1979)
Lowest grass minimum temperature -1.4°C (30th September 1988)
Warmest September 2006 (Mean temperature 18.1°C); coolest September 1972 (Mean temperature 12.0°C)
Average September rainfall (30 years 1971/2000) 57.2 mm
Wettest September 1995 (Rainfall 138.7 mm); driest September 1996 (Rainfall 11.8 mm)
Wettest Day 22nd September 1992 (Rainfall 78.1 mm);
Highest number of "rain days" (0.2 mm or more) 21 (1974, 1995); lowest number of "rain days" 5 (1986)
Highest number of days with thunder 6 (1984)
|
|
|
|
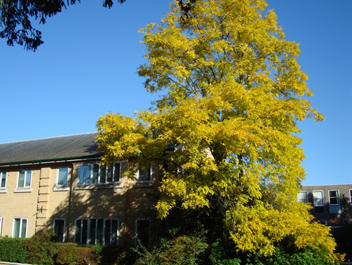
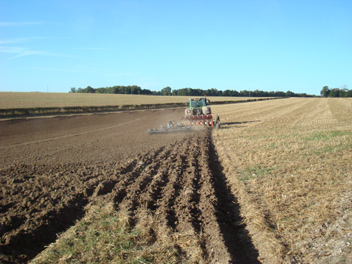
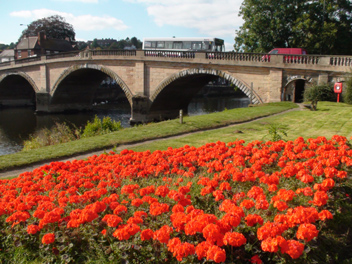
| This attractively coloured Robinia tree in Melbourn Street, Royston has become a landmark in its own right, particularly as it is situated between the Police Station (pictured) on its western side and the Town Hall on the other, with the Health Centre (partly visible) to the rear! It is viewed here on 22nd September 2009 at 0827 GMT. The temperature at this time was was 15.4°C and a WSW wind of mean speed 9 knots gusting to 15 knots was refreshing the town air. The clear blue sky heralded a pleasant early Autumn day with a maximum temperature of 21.3°C (after an overnight minimum of 12.2°C) and sunshine of 8.1 hours. | The tractor in this photograph is dragging an additional attachment so that the soil can be ploughed and rolled at the same time. This scene is at Burloes to the SE of the town of Royston on 24th September 2009 at 0801 GMT. Royston has been experiencing a long dry spell with only 8.3 miilimetres rainfall in September up to this date, and only 22.1 millimetres rainfall since 6th August. One of the effects of this is that Autumn ploughing operations in the District have been characterised by large clouds of soil propelled into the air by the ploughs. The field in this picture was fully sown with next season's crop by 28th September. | Moving away from Royston for the last picture this month this is the bridge over the River Severn at Bewdley, Worcestershire (158 km WNW of Royston), as viewed at 1337 GMT on 26th September 2009. This location has suffered serious flooding events in the past but on this occasion the water was so low that it was possible to walk out into the river on the dry exposed river bed. This indicates that the dry conditions mentioned in the adjacent caption have extended right across the country to mid-Wales where the River Severn has its source at Plynlimon Fawr. This bed of geraniums is part of a fine display of flowers at this location. |
Return to Welcome to Royston (Iceni) Weather Station page
(This page last updated 13th October 2009 2014 GMT)