Royston (Iceni) Weather Station
Daily Weather
Observations - May
2009
(All Times GMT)
| Date |
Max.
Temp. (°C) 09/09h |
Min.
Temp. (°C) 09/09h |
Grass
Min. Temp. (°C) 21/09h |
Earth
(30cms) Temp. (°C) 09h |
Sun
(Hours) 00/00h |
R'fall
(MM) 09/09h |
Wind
Dir'n 09h |
Mean
Wind Speed (MPH) 00/00h |
Max.
Gust Speed (MPH) 00/00h |
Cloud
Cover (Oktas) 09h |
Mean
MSL Air Pressure (mB) 00/00h |
Mean
Rel. Humd. (%) 00/00h |
Mean
Temp. (°C) 00/00h |
Fog
(vis. <1000m @ 09h) |
Fog
(vis. <200m @ 09h) |
Snow
or Rain and Snow 00/00h |
Snow
Lying @ 09h (>50% cover) |
Hail
00/00h |
Thunder
00/00h |
Date |
| 1 |
20.8 |
9.4 |
5.9 |
12.9 |
8.8 |
0.0 |
S |
5.1 |
25 |
0 |
1020.6 |
72.4 |
14.8 |
0 |
0 |
0 |
0 |
0 |
0 |
1 |
| 2 |
19.1 |
8.0 |
5.5 |
13.3 |
12.0 |
TR |
W |
4.1 |
16 |
2 |
1024.8 |
70.1 |
13.3 |
0 |
0 |
0 |
0 |
0 |
0 |
2 |
| 3 |
15.5 |
8.4 |
6.4 |
13.6 |
5.9 |
0.0 |
NW |
7.4 |
32 |
7 |
1024.2 |
63.6 |
10.6 |
0 |
0 |
0 |
0 |
0 |
0 |
3 |
| 4 |
13.6 |
5.0 |
1.3 |
13.2 |
1.0 |
0.3 |
W |
5.0 |
25 |
7 |
1023.5 |
76.8 |
9.3 |
0 |
0 |
0 |
0 |
0 |
0 |
4 |
| 5 |
19.0 |
10.3 |
8.5 |
13.0 |
2.1 |
0.0 |
W |
6.8 |
21 |
8 |
1018.5 |
79.8 |
13.3 |
0 |
0 |
0 |
0 |
0 |
0 |
5 |
| 6 |
19.3 |
10.4 |
8.9 |
13.3 |
5.1 |
0.0 |
W |
9.4 |
39 |
7 |
1014.0 |
76.2 |
14.0 |
0 |
0 |
0 |
0 |
0 |
0 |
6 |
| 7 |
17.5 |
9.6 |
8.2 |
13.5 |
3.7 |
0.7 |
W |
7.0 |
38 |
8 |
1009.5 |
76.7 |
13.0 |
0 |
0 |
0 |
0 |
0 |
0 |
7 |
| 8 |
15.2 |
8.5 |
7.1 |
13.8 |
8.9 |
1.8 |
W |
9.2 |
45 |
8 |
1008.6 |
71.2 |
10.7 |
0 |
0 |
0 |
0 |
0 |
0 |
8 |
| 9 |
16.2 |
6.2 |
4.8 |
13.3 |
7.7 |
0.0 |
SW |
5.6 |
26 |
4 |
1014.1 |
67.0 |
11.4 |
0 |
0 |
0 |
0 |
0 |
0 |
9 |
| 10 |
19.8 |
6.4 |
2.4 |
13.5 |
10.1 |
0.0 |
E |
2.2 |
20 |
0 |
1017.8 |
66.9 |
12.8 |
0 |
0 |
0 |
0 |
0 |
0 |
10 |
| 11 |
17.5 |
3.4 |
0.5 |
13.8 |
13.6 |
0.0 |
NE |
5.5 |
31 |
2 |
1021.3 |
73.9 |
10.0 |
0 |
0 |
0 |
0 |
0 |
0 |
11 |
| 12 |
17.9 |
5.6 |
4.0 |
13.8 |
10.9 |
0.1 |
NE |
6.1 |
33 |
2 |
1019.8 |
71.4 |
10.8 |
0 |
0 |
0 |
0 |
0 |
0 |
12 |
| 13 |
14.6 |
6.9 |
4.0 |
13.9 |
0.0 |
0.2 |
E |
2.3 |
20 |
8 |
1012.9 |
86.4 |
11.4 |
0 |
0 |
0 |
0 |
0 |
0 |
13 |
| 14 |
15.8 |
10.8 |
10.5 |
13.6 |
0.0 |
1.5 |
N |
0.6 |
13 |
8 |
1006.0 |
94.7 |
12.8 |
0 |
0 |
0 |
0 |
0 |
0 |
14 |
| 15 |
16.0 |
10.6 |
10.0 |
13.6 |
1.8 |
2.2 |
SW |
4.6 |
30 |
8 |
999.6 |
86.3 |
12.1 |
0 |
0 |
0 |
0 |
0 |
0 |
15 |
| 16 |
16.6 |
6.2 |
4.8 |
13.6 |
6.2 |
4.6 |
SW |
7.0 |
35 |
5 |
1003.5 |
75.4 |
11.4 |
0 |
0 |
0 |
0 |
0 |
0 |
16 |
| 17 |
15.3 |
7.0 |
4.5 |
13.6 |
5.7 |
3.1 |
S |
6.3 |
36 |
8 |
1004.6 |
84.9 |
10.8 |
0 |
0 |
0 |
0 |
0 |
0 |
17 |
| 18 |
16.7 |
9.0 |
7.6 |
13.6 |
8.3 |
0.0 |
SW |
8.4 |
36 |
4 |
1009.6 |
77.4 |
12.3 |
0 |
0 |
0 |
0 |
0 |
0 |
18 |
| 19 |
17.0 |
8.8 |
7.5 |
13.8 |
7.8 |
0.6 |
SW |
7.0 |
33 |
5 |
1014.8 |
78.8 |
12.7 |
0 |
0 |
0 |
0 |
0 |
0 |
19 |
| 20 |
18.5 |
7.9 |
6.4 |
14.0 |
9.1 |
0.0 |
SW |
5.5 |
20 |
5 |
1016.7 |
73.0 |
13.3 |
0 |
0 |
0 |
0 |
0 |
0 |
20 |
| 21 |
19.4 |
8.9 |
7.0 |
14.1 |
9.7 |
0.3 |
SW |
6.4 |
31 |
6 |
1011.8 |
71.5 |
13.5 |
0 |
0 |
0 |
0 |
0 |
0 |
21 |
| 22 |
19.0 |
8.0 |
6.0 |
14.5 |
7.5 |
0.0 |
SW |
1.9 |
26 |
4 |
1014.6 |
70.2 |
13.9 |
0 |
0 |
0 |
0 |
0 |
0 |
22 |
| 23 |
21.7 |
9.0 |
5.7 |
15.0 |
11.9 |
0.0 |
W |
3.1 |
18 |
2 |
1015.1 |
61.1 |
16.0 |
0 |
0 |
0 |
0 |
0 |
0 |
23 |
| 24 |
23.1 |
7.5 |
4.4 |
15.0 |
15.9 |
0.0 |
NE |
2.1 |
16 |
0 |
1017.7 |
64.5 |
15.6 |
0 |
0 |
0 |
0 |
0 |
0 |
24 |
| 25 |
22.5 |
10.7 |
9.2 |
15.9 |
6.9 |
19.5 |
E |
3.3 |
20 |
8 |
1012.4 |
73.5 |
16.7 |
0 |
0 |
0 |
0 |
0 |
0 |
25 |
| 26 |
17.8 |
9.4 |
9.4 |
16.2 |
6.5 |
0.0 |
W |
9.9 |
30 |
8 |
1012.1 |
75.8 |
12.6 |
0 |
0 |
0 |
0 |
0 |
0 |
26 |
| 27 |
19.1 |
8.5 |
7.0 |
15.5 |
0.5 |
0.0 |
SW |
10.4 |
33 |
8 |
1019.6 |
80.8 |
12.2 |
0 |
0 |
0 |
0 |
0 |
0 |
27 |
| 28 |
23.2 |
12.8 |
11.0 |
15.0 |
6.4 |
0.0 |
W |
5.3 |
20 |
1 |
1027.6 |
74.4 |
17.5 |
0 |
0 |
0 |
0 |
0 |
0 |
28 |
| 29 |
23.2 |
12.3 |
9.3 |
15.9 |
13.7 |
0.0 |
E |
2.0 |
17 |
3 |
1029.9 |
70.5 |
16.9 |
0 |
0 |
0 |
0 |
0 |
0 |
29 |
| 30 |
22.7 |
8.6 |
6.2 |
16.0 |
16.0 |
0.0 |
E |
2.8 |
18 |
0 |
1025.9 |
66.9 |
15.3 |
0 |
0 |
0 |
0 |
0 |
0 |
30 |
| 31 |
25.5 |
7.9 |
5.1 |
16.4 |
15.7 |
0.0 |
N |
4.0 |
21 |
0 |
1025.1 |
72.4 |
16.4 |
0 |
0 |
0 |
0 |
0 |
0 |
31 |
| Total/Mean |
18.7 |
8.5 |
6.4 |
14.2 |
239.3 |
34.9 |
X |
5.4 |
X |
4.7 |
1016.0 |
74.3 |
13.1 |
0 |
0 |
0 |
0 |
0 |
0 |
Total/Mean |
| *Diff./% |
+1.7 |
+1.1 |
|
|
126% |
74% |
|
|
|
|
|
|
|
|
|
|
|
|
|
*Diff./% |
| Date |
Max.
Temp. (°C) 09/09h |
Min.
Temp. (°C) 09/09h |
Grass
Min. Temp. (°C) 21/09h |
Earth
(30cms) Temp. (°C) 09h |
Sun
(Hours) 00/00h |
R'fall
(MM) 09/09h |
Wind
Dir'n 09h |
Mean
Wind Speed (MPH) 00/00h |
Max.
Gust Speed (MPH) 00/00h |
Cloud
Cover (Oktas) 09h |
Mean
MSL Air Pressure (mB) 00/00h |
Mean
Rel. Humd. (%) 00/00h |
Mean
Temp. (°C) 00/00h |
Fog
(vis. <1000m @ 09h) |
Fog
(vis. <200m @ 09h) |
Snow
or Rain and Snow 00/00h |
Snow
Lying @ 09h (>50% cover) |
Hail
00/00h |
Thunder
00/00h |
Date |
Differences from
average:
Differences from
average shown in red.
Reference
periods used are as follows: Temperature
30 Years 1976/2005; rainfall
30
Years 1971/2000; sunshine
30 Years 1971/2000.
(*The differences from
average quoted during the course of the month relate to the cumulative daily
averages up to the date of the last observation, not the averages for the month
as a whole)
Additional Data:
Rainfall Duration 16.5
hours
Air Frost Duration NIL
hours
Graphs and Charts:
Click on the following links to
view this month's graphs and charts.....
1.
Daily
Maximum, Minimum & Grass Minimum Temperatures
2.
Daily
Maximum & Minimum Temperatures (with 30 Year Comparative Means)
3.
Daily
Earth (30 cms Depth) Temperature @ 0900 GMT 4.
Daily
Rainfall
5. Daily
Sunshine
6. Daily
Maximum Gust & Mean Wind Speed
7.
Daily
Wind Direction @ 0900 GMT
8. Daily
Mean MSL Air Pressure
9. Daily
Mean Relative Humidity
10. Thermograph
11.
Barograph
12. Hygrograph
13. Anemograph
14. Wind
Direction
15. Sunshine
Duration
16. Rainfall
Intensity & Duration
May 2009 Weather
Review:
......and click on the link below
for a text report of the May 2009 weather in Royston
May 2009 Weather Review
May (since 1972) at
Royston (Iceni) Weather Station:
Mean daily maximum temperature (30 years
1976/2005) 17.0°C
Mean daily minimum temperature (30 years
1976/2005) 7.4°C
Highest temperature 30.3°C
(27th May 2005); lowest temperature -1.0°C
(16th May1996)
Lowest grass minimum temperature -5.2°C
(16th May 1996)
Warmest May 1992
(Mean temperature 14.5°C);
coldest May 1984, 1996 (Mean
temperature 9.7°C)
Average May rainfall (30 years 1971/2000) 47.0
mm
Wettest May 2007
(Rainfall 147.5
mm); driest May 1990
(Rainfall 3.7
mm)
Wettest Day 27th
May 2007 (Rainfall 65.7
mm)
Highest number of "rain days" (0.2
mm or more) 22 (1983);
lowest number of "rain days" 3
(1990)
Highest number of days with thunder 8
(1983)
Highest number of air frosts 4
(1996)
Highest number of ground frosts 14
(1996)
Highest number of days with snow falling 2
(1997)
Highest number of days with snow lying (ground with
more than 50% snow cover @ 0900 GMT) 0
|
|
|
|
|
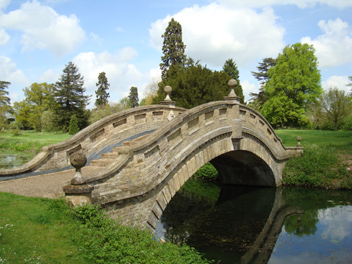
This picture is of the Chinese
Bridge at the delightful Wrest Park, Silsoe, Bedfordshire (27 km SSW of
Royston), taken at 1131 GMT on 2nd May 2009. Nearby is the Chinese Temple
which was originally built around the mid-1750's when a Chinese taste was
in vogue in England. The Chinese Temple has recently been rebuilt, and the
Chinese Bridge itself has been replaced several times, the one seen here
dating from 1876. The day was warm and mainly sunny both at Wrest Park and
at Royston, the maximum temperature at the latter location reaching
19.1°C, which is 3.3°C above the 30 Year (1976/2005)average for this
day. Sunshine at Royston was 12.0 hours. |
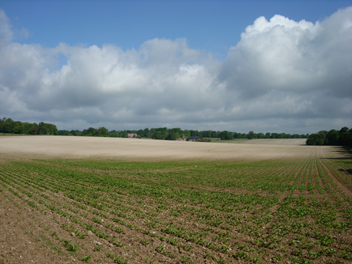
The large tract of land seen here (at
0814 GMT on 21st May 2009) stretches from the B1039 Royston to Saffron
Walden road (just behind the photographer) to near to the A505 road on the
eastern side of Royston. An even larger similar tract of land to the right
of the tree belt on the right does, in fact, stretch all the way to the
A505 without interruption. The Spring sown crop is just starting to
germinate as evident in the foreground whilst the light coloured nature of
the soil in the distance owes this characteristic to both the underlying
chalk and the dry weather of May so far (and the dry months of April and
March). A SW wind of mean speed 6 knots gusting to 12knots is in evidence,
in a temperature of 14.0°C. |
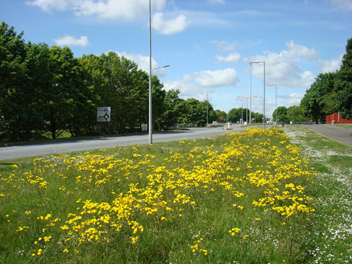
The scene here is a good example of
how wild flowers can enhance the urban environment. The location is the
wide verge at the side of the A1072 Martins Way in Stevenage (20 km SW of
Royston) which runs between the neighbourhoods of St. Nicholas and Pin
Green. This picture was taken at 1014 GMT on 22nd May 2009, and less than
two months prior to this the whole area now colonised by the wild flowers
was covered in daffodils (obviously set, not wild!). This view is looking
westwards from a position not too far from open country on the eastern
side of the town. The picture indicates a pleasant Spring day, and at
Royston the temperature reached 19.0°C and sunshine of 7.5 hours was
experienced. |
Return to Welcome
to Royston (Iceni) Weather Station page
(This page last updated 10th June 2009 2012 GMT)