Royston (Iceni) Weather Station
Daily Weather Observations - April 2009
(All Times GMT)
| Date | Max. Temp. (°C) 09/09h | Min. Temp. (°C) 09/09h | Grass Min. Temp. (°C) 21/09h | Earth (30cms) Temp. (°C) 09h | Sun (Hours) 00/00h | R'fall (MM) 09/09h | Wind Dir'n 09h | Mean Wind Speed (MPH) 00/00h | Max. Gust Speed (MPH) 00/00h | Cloud Cover (Oktas) 09h | Mean MSL Air Pressure (mB) 00/00h | Mean Rel. Humd. (%) 00/00h | Mean Temp. (°C) 00/00h | Fog (vis. <1000m @ 09h) | Fog (vis. <200m @ 09h) | Snow or Rain and Snow 00/00h | Snow Lying @ 09h (>50% cover) | Hail 00/00h | Thunder 00/00h | Date |
| 1 | 16.9 | 4.2 | -0.6 | 8.4 | 10.5 | 0.0 | E | 2.6 | 23 | 2 | 1020.7 | 75.0 | 9.8 | 0 | 0 | 0 | 0 | 0 | 0 | 1 |
| 2 | 15.7 | 3.0 | -0.7 | 8.7 | 6.7 | 0.0 | NE | 3.0 | 16 | 8 | 1018.6 | 90.8 | 8.2 | 1 | 0 | 0 | 0 | 0 | 0 | 2 |
| 3 | 11.2 | 4.3 | 4.2 | 9.0 | 3.8 | TR | N | 2.1 | 21 | 8 | 1014.7 | 95.2 | 7.0 | 1 | 0 | 0 | 0 | 0 | 0 | 3 |
| 4 | 17.3 | 6.5 | 5.0 | 9.0 | 8.1 | 0.0 | W | 6.0 | 25 | 8 | 1015.7 | 72.5 | 10.5 | 0 | 0 | 0 | 0 | 0 | 0 | 4 |
| 5 | 14.6 | 3.1 | -1.6 | 9.4 | 8.4 | TR | E | 1.5 | 16 | 3 | 1019.9 | 71.3 | 8.4 | 0 | 0 | 0 | 0 | 0 | 0 | 5 |
| 6 | 17.5 | 5.0 | 3.2 | 9.4 | 4.3 | 0.0 | SE | 4.8 | 28 | 7 | 1007.0 | 75.9 | 11.5 | 0 | 0 | 0 | 0 | 0 | 0 | 6 |
| 7 | 15.5 | 7.1 | 5.0 | 9.9 | 7.0 | 1.0 | W | 7.2 | 28 | 7 | 1004.1 | 72.4 | 10.3 | 0 | 0 | 0 | 0 | 0 | 0 | 7 |
| 8 | 15.5 | 7.6 | 5.7 | 10.0 | 11.3 | 0.5 | W | 9.7 | 48 | 1 | 1003.8 | 69.6 | 10.8 | 0 | 0 | 0 | 0 | 0 | 0 | 8 |
| 9 | 14.8 | 6.7 | 4.0 | 10.0 | 0.3 | TR | S | 6.3 | 28 | 8 | 1006.0 | 90.6 | 11.3 | 0 | 0 | 0 | 0 | 0 | 0 | 9 |
| 10 | 15.9 | 9.5 | 7.5 | 10.2 | 1.5 | 3.9 | SW | 3.9 | 25 | 7 | 1000.5 | 91.3 | 11.6 | 0 | 0 | 0 | 0 | 0 | 0 | 10 |
| 11 | 10.5 | 8.8 | 8.5 | 10.5 | 0.0 | 0.8 | N | 1.3 | 12 | 8 | 1006.5 | 99.7 | 9.2 | 0 | 0 | 0 | 0 | 0 | 0 | 11 |
| 12 | 12.5 | 7.6 | 7.5 | 10.3 | 0.1 | 0.0 | N | 1.0 | 12 | 8 | 1011.5 | 98.2 | 9.4 | 1 | 0 | 0 | 0 | 0 | 0 | 12 |
| 13 | 15.5 | 8.5 | 8.4 | 10.5 | 3.2 | 0.0 | N | 1.6 | 16 | 6 | 1008.2 | 88.9 | 11.0 | 0 | 0 | 0 | 0 | 0 | 0 | 13 |
| 14 | 15.6 | 6.2 | 5.8 | 10.9 | 1.8 | 1.6 | SE | 1.9 | 14 | 3 | 1006.9 | 88.7 | 11.2 | 0 | 0 | 0 | 0 | 0 | 0 | 14 |
| 15 | 21.0 | 6.9 | 5.1 | 11.1 | 5.0 | 1.1 | NE | 3.2 | 21 | 8 | 1005.2 | 65.1 | 14.0 | 0 | 0 | 0 | 0 | 0 | 1 | 15 |
| 16 | 13.5 | 9.9 | 8.6 | 11.9 | 0.0 | 8.1 | NE | 1.6 | 16 | 8 | 1004.6 | 96.4 | 10.6 | 0 | 0 | 0 | 0 | 0 | 0 | 16 |
| 17 | 13.5 | 7.5 | 7.5 | 11.4 | 0.0 | 0.0 | N | 3.0 | 18 | 8 | 1007.8 | 93.6 | 9.0 | 1 | 0 | 0 | 0 | 0 | 0 | 17 |
| 18 | 16.5 | 2.2 | -1.5 | 11.0 | 11.6 | 0.0 | NE | 4.4 | 21 | 2 | 1016.0 | 84.5 | 8.7 | 0 | 0 | 0 | 0 | 0 | 0 | 18 |
| 19 | 16.8 | 5.0 | 2.4 | 11.3 | 9.7 | 0.0 | NE | 4.0 | 21 | 7 | 1022.0 | 84.7 | 9.4 | 0 | 0 | 0 | 0 | 0 | 0 | 19 |
| 20 | 18.5 | 3.6 | -0.1 | 11.7 | 9.3 | 0.0 | NE | 1.1 | 12 | 8 | 1024.7 | 79.6 | 9.8 | 0 | 0 | 0 | 0 | 0 | 0 | 20 |
| 21 | 20.4 | 1.7 | -1.3 | 11.9 | 13.2 | 0.0 | N | 2.1 | 18 | 0 | 1023.8 | 73.0 | 11.5 | 0 | 0 | 0 | 0 | 0 | 0 | 21 |
| 22 | 19.0 | 5.5 | 1.3 | 12.0 | 13.3 | 0.0 | E | 1.6 | 16 | 1 | 1023.3 | 68.0 | 11.8 | 0 | 0 | 0 | 0 | 0 | 0 | 22 |
| 23 | 19.6 | 8.0 | 5.6 | 12.4 | 9.4 | 0.0 | SW | 4.3 | 18 | 7 | 1019.6 | 73.3 | 13.0 | 0 | 0 | 0 | 0 | 0 | 0 | 23 |
| 24 | 18.6 | 7.0 | 4.0 | 12.7 | 13.1 | 0.0 | S | 4.3 | 30 | 1 | 1012.1 | 71.0 | 12.1 | 0 | 0 | 0 | 0 | 0 | 0 | 24 |
| 25 | 16.5 | 7.6 | 4.0 | 13.0 | 7.8 | 0.0 | SW | 4.9 | 25 | 7 | 1004.8 | 66.6 | 11.2 | 0 | 0 | 0 | 0 | 0 | 0 | 25 |
| 26 | 18.0 | 5.2 | 1.0 | 12.4 | 12.4 | TR | S | 3.8 | 21 | 1 | 1004.5 | 59.9 | 11.8 | 0 | 0 | 0 | 0 | 0 | 0 | 26 |
| 27 | 11.1 | 6.0 | 4.0 | 12.4 | 1.5 | 2.0 | S | 5.5 | 39 | 8 | 994.1 | 88.6 | 8.1 | 0 | 0 | 0 | 0 | 0 | 0 | 27 |
| 28 | 15.4 | 4.0 | 0.4 | 11.8 | 7.3 | 0.4 | W | 1.4 | 14 | 3 | 999.0 | 80.9 | 8.7 | 0 | 0 | 0 | 0 | 0 | 0 | 28 |
| 29 | 17.8 | 3.9 | -0.6 | 12.0 | 12.2 | 0.0 | SW | 3.5 | 18 | 0 | 1006.9 | 69.9 | 11.3 | 0 | 0 | 0 | 0 | 0 | 0 | 29 |
| 30 | 18.1 | 6.5 | 4.9 | 12.4 | 3.7 | 0.0 | S | 4.7 | 25 | 6 | 1013.7 | 78.0 | 12.4 | 0 | 0 | 0 | 0 | 0 | 0 | 30 |
| Total/Mean | 16.1 | 6.0 | 3.6 | 10.9 | 196.2 | 19.4 | X | 3.5 | X | 5.3 | 1010.9 | 80.4 | 10.5 | 4 | 0 | 0 | 0 | 0 | 1 | Total/Mean |
| *Diff./% | +3.0 | +1.5 | 135% | 44% | *Diff./% | |||||||||||||||
| Date | Max. Temp. (°C) 09/09h | Min. Temp. (°C) 09/09h | Grass Min. Temp. (°C) 21/09h | Earth (30cms) Temp. (°C) 09h | Sun (Hours) 00/00h | R'fall (MM) 09/09h | Wind Dir'n 09h | Mean Wind Speed (MPH) 00/00h | Max. Gust Speed (MPH) 00/00h | Cloud Cover (Oktas) 09h | Mean MSL Air Pressure (mB) 00/00h | Mean Rel. Humd. (%) 00/00h | Mean Temp. (°C) 00/00h | Fog (vis. <1000m @ 09h) | Fog (vis. <200m @ 09h) | Snow or Rain and Snow 00/00h | Snow Lying @ 09h (>50% cover) | Hail 00/00h | Thunder 00/00h | Date |
Differences from average:
Differences from average shown in red. Reference periods used are as follows: Temperature 30 Years 1976/2005; rainfall 30 Years 1971/2000; sunshine 30 Years 1971/2000.
(*The differences from average quoted during the course of the month relate to the cumulative daily averages up to the date of the last observation, not the averages for the month as a whole)
Additional Data:
Rainfall Duration 15.3 hours
Air Frost Duration NIL hours
Graphs and Charts:
Click on the following links to view this month's graphs and charts.....
1. Daily Maximum, Minimum & Grass Minimum Temperatures
2. Daily Maximum & Minimum Temperatures (with 30 Year Comparative Means)
3. Daily Earth (30 cms Depth) Temperature @ 0900 GMT 4. Daily Rainfall 5. Daily Sunshine
6. Daily Maximum Gust & Mean Wind Speed 7. Daily Wind Direction @ 0900 GMT
8. Daily Mean MSL Air Pressure 9. Daily Mean Relative Humidity 10. Thermograph
11. Barograph 12. Hygrograph 13. Anemograph 14. Wind Direction
15. Sunshine Duration 16. Rainfall Intensity & Duration
April 2009 Weather Review:
......and click on the link below for a text report of the April 2009 weather in Royston
April (since 1973) at Royston (Iceni) Weather Station:
Mean daily maximum temperature (30 years 1976/2005) 13.1°C
Mean daily minimum temperature (30 years 1976/2005) 4.5°C
Highest temperature 25.5°C (16th April 2003); lowest temperature -4.1°C (11th April 1978)
Lowest grass minimum temperature -9.4°C (4th April 1996)
Warmest April 2007 (Mean temperature 12.3°C); coldest April 1978 (Mean temperature 6.2°C)
Average April rainfall (30 years 1971/2000) 44.3 mm
Wettest April 1998 (Rainfall 120.7 mm); driest April 2007 (Rainfall 1.6 mm)
Wettest Day 9th April 1998 (Rainfall 32.0 mm);
Highest number of "rain days" (0.2 mm or more) 26 (1998); lowest number of "rain days" 3 (2007)
Highest number of days with thunder 7 (1998)
Highest number of air frosts 8 (1975)
Highest number of ground frosts 15 (1974, 1984)
Highest number of days with snow falling 5 (1975, 1986)
Highest number of days with snow lying (ground with more than 50% snow cover @ 0900 GMT) 2 (1978, 1983)
|
|
|
|
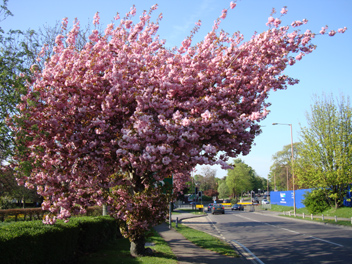
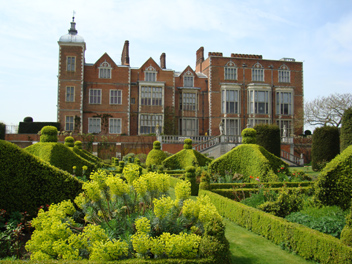
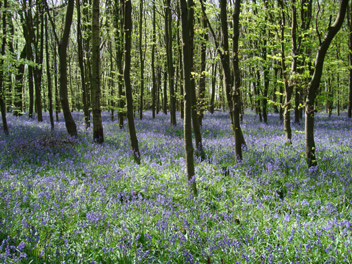
| The kanzan cherry trees on the western side of Priory Lane (A10 road) in Royston have this Spring once again given their usual reliable display of blossom, as seen in this photograph taken at 1556 GMT on 21st April 2009. This view is looking northwards towards the Town Hall roundabout and beyond to Cambridge. The temporary blue boarding on the right of the picture has recently been erected around the site of the demolished cinema. The temperature at this time in the afternoon is still as high as 19.5°C after a maximum for the day of 20.4°C, this latter value being significantly above (5.1°C) the 30 Year (1976/2205) average for this day in April. Sunshine for the day was 13.2 hours. | Situated some 32 km SSW of Royston, this is Hatfield House, a Jacobean house built in 1611 by Robert Cecil, 1st Earl of Salisbury and Chief Minister to King James I. The House is much more extensive than suggested by this elevation, and exhibits superb examples of Jacobean craftmanship, such as the finely carved Grand Staircase and the Chapel's stained glass window. This picture was taken (at 1231 GMT on 23rd April 2009) from the East Garden which features elegant parterres, magnificent topiary and various rare plants. This day continued the April fine spell, and with sunshine of 9.4 hours (at Royston) and a maximum temperature of 19.6°C it was a very pleasant Spring day. | One of the best displays of bluebells in Hertfordshire is undoubtedly to be found at Martins Wood in Stevenage (20 km SW of Royston), where several acres of woodland are covered by these flowers each Spring. Here the new leaves on the trees are not fully out, allowing the bright sunshine on this day (24th April 2009, at 1119 GMT) to filter through and enhance the visual impact of the display. This picture was taken in a remarkable spell of April weather in which in the 9 days from 18th to 26th inclusive a sunshine total of 99.7 hours was accumulated at Royston, and temperatures were well above average. For example, sunshine on this day was 13.1 hours and the temperature reached 18.6°C (at Royston). |
Return to Welcome to Royston (Iceni) Weather Station page
(This page last updated 8th May 2009 1940 GMT)