Royston (Iceni) Weather Station
Daily Weather Observations - January 2009
(All Times GMT)
| Date | Max. Temp. (°C) 09/09h | Min. Temp. (°C) 09/09h | Grass Min. Temp. (°C) 21/09h | Earth (30cms) Temp. (°C) 09h | Sun (Hours) 00/00h | R'fall (MM) 09/09h | Wind Dir'n 09h | Mean Wind Speed (MPH) 00/00h | Max. Gust Speed (MPH) 00/00h | Cloud Cover (Oktas) 09h | Mean MSL Air Pressure (mB) 00/00h | Mean Rel. Humd. (%) 00/00h | Mean Temp. (°C) 00/00h | Fog (vis. <1000m @ 09h) | Fog (vis. <200m @ 09h) | Snow or Rain and Snow 00/00h | Snow Lying @ 09h (>50% cover) | Hail 00/00h | Thunder 00/00h | Date |
| 1 | 1.0 | -0.5 | -0.7 | 3.9 | 0.0 | 0.1 | CALM | 0.1 | 5 | 8 | 1028.2 | 98.3 | -0.2 | 0 | 0 | 0 | 0 | 0 | 0 | 1 |
| 2 | 3.4 | -1.1 | -3.0 | 4.0 | 0.1 | 0.0 | N | 0.7 | 16 | 8 | 1028.4 | 94.9 | 0.4 | 1 | 0 | 0 | 0 | 0 | 0 | 2 |
| 3 | 2.0 | -5.0 | -9.3 | 3.7 | 2.4 | 0.0 | CALM | 0.3 | 9 | 6 | 1027.7 | 84.5 | -2.0 | 0 | 0 | 0 | 0 | 0 | 0 | 3 |
| 4 | 0.6 | -2.5 | -5.5 | 3.1 | 0.0 | 2.1 | W | 5.0 | 21 | 7 | 1020.2 | 86.0 | -1.4 | 0 | 0 | 0 | 0 | 0 | 0 | 4 |
| 5 | 2.1 | -1.6 | -2.5 | 3.0 | 4.8 | TR | NE | 3.7 | 23 | 8 | 1020.7 | 90.9 | -0.7 | 0 | 0 | 1 | 1 | 0 | 0 | 5 |
| 6 | 0.6 | -7.0 | -14.0 | 2.8 | 6.8 | TR | CALM | 0.6 | 16 | 0 | 1025.0 | 86.7 | -4.5 | 0 | 0 | 0 | 1 | 0 | 0 | 6 |
| 7 | 2.0 | -4.9 | -9.8 | 2.5 | 0.2 | 0.0 | NW | 2.9 | 18 | 8 | 1023.6 | 94.3 | -0.0 | 0 | 0 | 1 | 1 | 0 | 0 | 7 |
| 8 | 5.8 | 1.0 | -0.1 | 2.5 | 4.1 | 0.0 | SW | 0.8 | 9 | 8 | 1026.8 | 94.5 | 1.6 | 0 | 0 | 0 | 0 | 0 | 0 | 8 |
| 9 | -1.3 | -4.5 | -7.0 | 2.5 | 0.5 | 0.0 | S | 0.4 | 14 | 8 | 1026.9 | 99.5 | -2.6 | 1 | 0 | 0 | 0 | 0 | 0 | 9 |
| 10 | 3.5 | -4.6 | -5.0 | 2.4 | 0.0 | 0.0 | SW | 4.6 | 35 | 8 | 1024.2 | 98.8 | -3.0 | 0 | 0 | 0 | 0 | 0 | 0 | 10 |
| 11 | 8.5 | -0.5 | -1.7 | 2.4 | 4.7 | 3.8 | S | 13.0 | 41 | 6 | 1019.0 | 87.4 | 5.2 | 0 | 0 | 0 | 0 | 0 | 0 | 11 |
| 12 | 9.6 | 6.8 | 5.5 | 2.5 | 0.1 | 2.0 | SW | 12.9 | 44 | 8 | 1007.4 | 96.0 | 8.0 | 0 | 0 | 0 | 0 | 0 | 0 | 12 |
| 13 | 8.8 | 6.1 | 4.4 | 3.9 | 0.1 | TR | SW | 5.9 | 23 | 6 | 1006.4 | 95.0 | 6.8 | 0 | 0 | 0 | 0 | 0 | 0 | 13 |
| 14 | 5.0 | 0.5 | -3.0 | 4.0 | 5.7 | 0.0 | SW | 3.7 | 25 | 1 | 1011.0 | 98.9 | 1.7 | 0 | 0 | 0 | 0 | 0 | 0 | 14 |
| 15 | 5.5 | 2.4 | 1.7 | 3.6 | 0.0 | 0.2 | SE | 6.3 | 28 | 8 | 1010.5 | 96.4 | 4.3 | 0 | 0 | 0 | 0 | 0 | 0 | 15 |
| 16 | 8.9 | 3.7 | 3.0 | 4.0 | 0.8 | 2.0 | S | 7.4 | 30 | 8 | 1010.0 | 96.5 | 6.2 | 0 | 0 | 0 | 0 | 0 | 0 | 16 |
| 17 | 9.0 | 7.0 | 5.5 | 4.6 | 4.6 | 4.1 | SW | 11.8 | 53 | 6 | 1001.9 | 87.9 | 7.9 | 0 | 0 | 0 | 0 | 0 | 0 | 17 |
| 18 | 6.5 | 3.5 | 1.3 | 5.0 | 6.3 | 5.7 | SW | 9.3 | 32 | 7 | 991.6 | 88.9 | 4.4 | 0 | 0 | 0 | 0 | 0 | 0 | 18 |
| 19 | 6.5 | 2.9 | 1.6 | 4.5 | 1.9 | 0.0 | SW | 8.1 | 35 | 8 | 978.5 | 92.1 | 4.1 | 0 | 0 | 0 | 0 | 0 | 0 | 19 |
| 20 | 5.2 | 1.5 | -0.3 | 4.4 | 4.2 | 0.0 | SW | 6.4 | 28 | 5 | 987.8 | 93.8 | 2.7 | 0 | 0 | 0 | 0 | 0 | 0 | 20 |
| 21 | 8.0 | -0.1 | -1.8 | 3.9 | 5.0 | 3.9 | S | 6.3 | 39 | 7 | 997.6 | 93.2 | 2.6 | 0 | 0 | 0 | 0 | 0 | 0 | 21 |
| 22 | 9.4 | 4.5 | 3.9 | 3.8 | 1.9 | 3.9 | S | 9.5 | 41 | 8 | 982.2 | 93.8 | 6.3 | 0 | 0 | 0 | 0 | 0 | 0 | 22 |
| 23 | 4.9 | 3.8 | 3.0 | 4.5 | 1.5 | 4.3 | NW | 7.4 | 39 | 8 | 972.6 | 92.4 | 3.6 | 0 | 0 | 1 | 0 | 0 | 0 | 23 |
| 24 | 6.4 | 0.3 | -2.5 | 4.2 | 1.5 | 6.1 | W | 4.8 | 25 | 7 | 986.7 | 92.7 | 2.3 | 0 | 0 | 0 | 0 | 0 | 0 | 24 |
| 25 | 7.0 | 2.4 | 1.1 | 3.9 | 0.0 | 4.7 | S | 6.6 | 35 | 8 | 983.4 | 98.7 | 5.7 | 0 | 0 | 0 | 0 | 0 | 0 | 25 |
| 26 | 8.0 | 2.7 | -0.6 | 4.5 | 2.9 | 0.0 | S | 1.1 | 12 | 8 | 997.4 | 96.4 | 4.8 | 0 | 0 | 0 | 0 | 0 | 0 | 26 |
| 27 | 7.5 | 1.7 | -2.6 | 4.5 | 7.0 | 3.5 | S | 4.6 | 23 | 4 | 1009.8 | 95.1 | 4.0 | 0 | 0 | 0 | 0 | 0 | 0 | 27 |
| 28 | 6.0 | 3.8 | 2.9 | 4.2 | 0.0 | 2.9 | S | 6.2 | 23 | 8 | 1011.4 | 99.4 | 4.8 | 0 | 0 | 0 | 0 | 0 | 0 | 28 |
| 29 | 4.7 | 1.3 | 1.1 | 4.7 | 6.4 | 0.0 | S | 4.3 | 25 | 8 | 1014.3 | 94.4 | 2.4 | 0 | 0 | 0 | 0 | 0 | 0 | 29 |
| 30 | 5.2 | 0.5 | -1.3 | 4.1 | 5.3 | 0.0 | SE | 5.0 | 28 | 4 | 1013.3 | 92.0 | 2.5 | 0 | 0 | 0 | 0 | 0 | 0 | 30 |
| 31 | 6.1 | 2.7 | 1.2 | 3.9 | 7.1 | 0.0 | SE | 5.9 | 28 | 6 | 1010.1 | 86.0 | 2.7 | 0 | 0 | 0 | 0 | 0 | 0 | 31 |
| Total/Mean | 5.4 | 0.9 | -1.1 | 3.7 | 85.7 | 49.3 | X | 5.3 | X | 6.7 | 1008.2 | 93.4 | 2.6 | 2 | 0 | 3 | 3 | 0 | 0 | Total/Mean |
| *Diff./% | -1.2 | -1.2 | 154% | 96% | *Diff./% | |||||||||||||||
| Date | Max. Temp. (°C) 09/09h | Min. Temp. (°C) 09/09h | Grass Min. Temp. (°C) 21/09h | Earth (30cms) Temp. (°C) 09h | Sun (Hours) 00/00h | R'fall (MM) 09/09h | Wind Dir'n 09h | Mean Wind Speed (MPH) 00/00h | Max. Gust Speed (MPH) 00/00h | Cloud Cover (Oktas) 09h | Mean MSL Air Pressure (mB) 00/00h | Mean Rel. Humd. (%) 00/00h | Mean Temp. (°C) 00/00h | Fog (vis. <1000m @ 09h) | Fog (vis. <200m @ 09h) | Snow or Rain and Snow 00/00h | Snow Lying @ 09h (>50% cover) | Hail 00/00h | Thunder 00/00h | Date |
Differences from average:
Differences from average shown in red. Reference periods used are as follows: Temperature 30 Years 1976/2005; rainfall 30 Years 1971/2000; sunshine 30 Years 1971/2000.
(*The differences from average quoted during the course of the month relate to the cumulative daily averages up to the date of the last observation, not the averages for the month as a whole)
Additional Data:
Rainfall Duration 46.5 hours
Air Frost Duration 164.0 hours
Graphs and Charts:
Click on the following links to view this month's graphs and charts.....
1. Daily Maximum, Minimum & Grass Minimum Temperatures
2. Daily Maximum & Minimum Temperatures (with 30 Year Comparative Means)
3. Daily Earth (30 cms Depth) Temperature @ 0900 GMT 4. Daily Rainfall 5. Daily Sunshine
6. Daily Maximum Gust & Mean Wind Speed 7. Daily Wind Direction @ 0900 GMT
8. Daily Mean MSL Air Pressure 9. Daily Mean Relative Humidity 10. Thermograph
11. Barograph 12. Hygrograph 13. Anemograph 14. Wind Direction
15. Sunshine Duration 16. Rainfall Intensity & Duration
January 2009 Weather Review:
......and click on the link below for a text report of the January 2009 weather in Royston
January (since 1973) at Royston (Iceni) Weather Station:
Mean day maximum temperature (30 years 1976/2005) 6.6°C
Mean night minimum temperature (30 years 1976/2005) 2.1°C
Highest temperature 14.2°C (6th January 1999); lowest temperature -12.7°C (14th January 1982)
Lowest grass minimum temperature -18.1°C (10th January 1982)
Warmest January 2007, 2008 (Mean temperature 7.4°C); coldest January 1979 (Mean temperature 0.1°C)
Average January rainfall (30 years 1971/2000) 51.2 mm
Wettest January 1995 (Rainfall 108.2 mm); driest January 1987 (Rainfall 9.6 mm)
Wettest Day 9th January 1992 (Rainfall 25.1 mm);
Highest number of "rain days" (0.2 mm or more) 25 (1988, 2004); lowest number of "rain days" 9 (1992)
Highest number of days with thunder 1 (1974, 1984. 1988, 1994, 1998 and 2004)
Highest number of air frosts 20 (1979, 1985)
Highest number of ground frosts 25 (1979)
Highest number of days with snow falling 15 (1985)
Highest number of days with snow lying (ground with more than 50% snow cover @ 0900 GMT) 17 (1985)
|
|
|
|
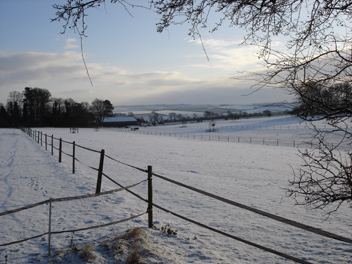
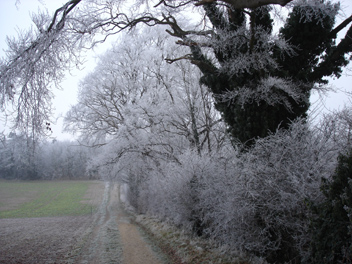
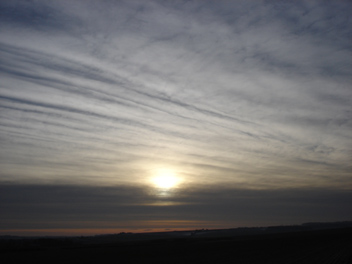
| In the early morning of 5th January 2009 Royston experienced the first snowfall of the year with a 2 cm level covering. When this photograph was taken at 0959 GMT the cloud from the southward moving cold front was just clearing the area and the first rays of sunshine were illuminating the countryside. This picture shows the scene looking across the paddocks at Burloes towards the village of Great Chishill on the horizon. An easterly wind of mean speed 4 knots gusting to 10 knots is in evidence in a temperature of -0.3°C (later rising to a maximum for the day of 2.1°C). The day's sunshine amounted to 4.8 hours. | A large anticyclone over central Europe had extended a ridge of high pressure over the British Isles on 10th January 2009 and this was responsible for the frosty conditions seen here (at 0940 GMT). The location is very close to that of the previous photograph but with a S-N orientation along a farm track instead of the W-E view across the paddocks. The temperature at the time was -4.3°C after an overnight minimum of -4.6°C, whilst a light air of mean speed 2 knots from the S drifted across the landscape. Despite there being no sunshine at all that day the temperature recovered to a maximum of 3.5°C. | On 10th January 2009 satellite images of the British Isles exhibited distinct lines of cloud with a SE-NW orientation across the country, formed ahead of an eastwards moving frontal system. Unfortunately these unusual large scale cloud formations were obscured from the ground by persistent low cloud but the next morning when this photograph was taken from Royston (at 0904 GMT) they appeared to be still in evidence and came into view as illustrated above ('ground truth'). The phenomenon soon disappeared although faint traces could still be seen later in the day on satellite photographs over northern France. |
Return to Welcome to Royston (Iceni) Weather Station page
(This page last updated 9th February 2009 2058 GMT)